BestOptionsStrategiesforSmallAccountS
HOW TO GET THE MOST OUT OF THIS BOOK

Thank you for accessing “Best Options Strategies for Small Accounts”. This book is designed for beginning, intermediate and advanced traders. The authors in this book are leading experts in trading options and stocks.

As you read this book, you will be exposed to multiple strategies that have high probabilities of success and/or high profit. Most of the strategies in this book are divided into three sections:

In short, you will have all of the information you need to trade your new favorite strategy tomorrow. Some of the things you will learn in this book are:

At OptionPub, it is our sincere hope that you take away several strategies that you can use when you are done reading this book. You will also learn about markets that you currently don’t trade, and you will find out if they are suited to your trading personality.

Finally, make sure to subscribe to OptionPub. We provide free eBooks, on-demand videos and many other publications for active traders in all of the markets. Our collaborators are world-renowned industry experts and our content is provided free of charge in a relaxed and friendly setting. Cheers to your trading success!

Chapter
01

3 Options Strategies To Maximize Your Profits In A Small Account

By Mike Ryske, NetPicks.com

Trading with a small account size is an issue many traders have to deal with at some point during their trading career. In a recent survey that we sent to traders, we asked what the reasons were for not registering for one of our upcoming Options training webinars. Towards the top of that list of responses was the feeling that their account size isn’t big enough to trade options. What really baffles me, is that traders often think they need to go to the futures or forex markets when they have a small account size. When in reality, you need a much larger account size to trade many of those markets when compared to options. Unfortunately, people are so programmed to think trading options requires a large amount of capital. This couldn’t be any farther from the truth.

In this article, we will talk about some of the key strategies to focus on if you are trading with a small account size. What do I consider a small account? For our example, we will consider the $10,000 account as our line in the sand. We will take a look at 3 of my favorite strategies that you can use to increase your performance in your own trading. These are strategies that I feel all traders should have in their toolbox regardless of how big or small their account size. Let’s start by walking through how we can use the options basics to help select the proper strategy to trade.

How can you use the options basics to boost your profits?

If you are a trader or investor you can probably remember back to when you first got introduced to the markets. “Buy low sell high.” “Invest for the long term in companies that you know and understand and who have good fundamentals.” These are some of the common methodologies taught in business schools and promoted by financial planners. As a result, in many cases traders go into trading options with the same approach. Buying long calls and puts as a way to play the markets moving up or down is a common starting point. The problem with this approach is that buying long calls or puts is much different than buying or selling shares of stock. The prices of these options are influenced by other factors than just stock direction. Understanding how these different factors influence the price of an option can really help you improve your trading results in the long run.

The option pricing model actually has 6 different inputs which can influence the movement in your options. While stock price is a big input in the price of an option, there are other factors in play that are crucial to understand if you desire to see success with your trading. The 6 inputs in the pricing model of an option are Stock Price, Strike Price, Time to Expiration, Volatility, Interest Rates and Dividends. We are going to talk about Volatility and Time to Expiration in more detail as these two can cause the biggest issues with the way many retail traders use options.

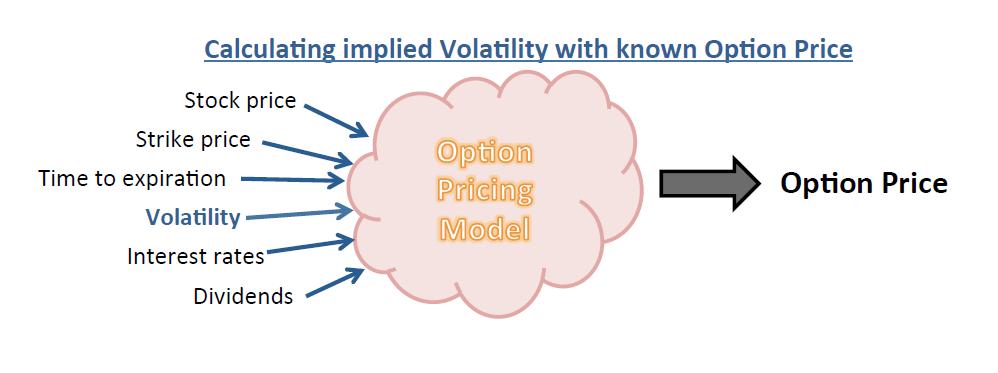
Of the 6 inputs that go into the option pricing model 5 can be easily determined. Stock price, strike price, time to expiration, interest rates, and dividends are easily found. The one wild card is volatility, as it is constantly changing throughout each trading session.

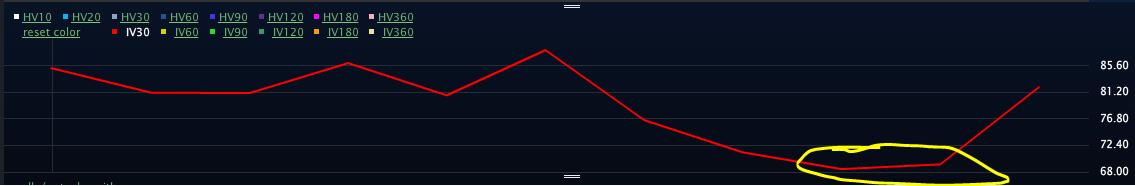
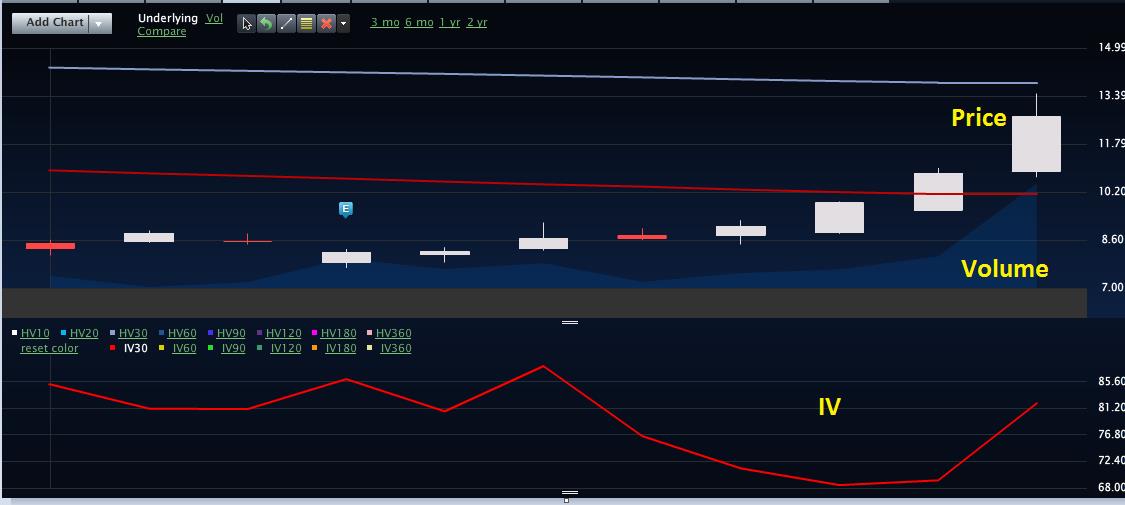
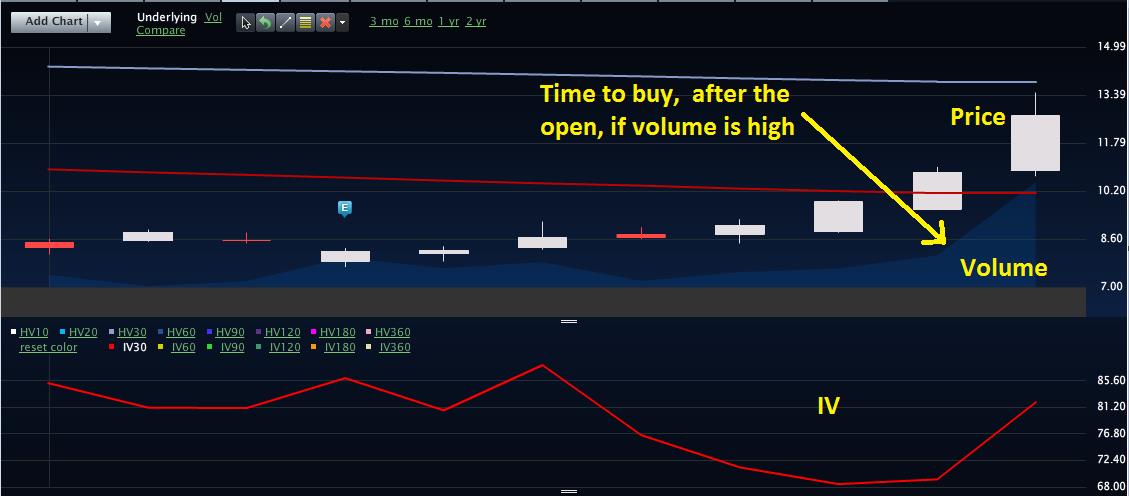
The pricing model actually works backwards to determine which level of volatility is being used to generate the current price of an option. It takes the 5 known inputs and backs them out of the current option price being quoted to get the volatility. This is known as Implied Volatility. In order to trade options successfully it’s important to understand when Implied Volatility is high or low for each product that you trade. If you don’t understand volatility, then you could potentially see a directional move in your favor and still not make money. This would happen if you were long a call option and got a move higher in the stock but a drop in implied volatility. This could result in a lower profit return or even worse no profit at all.

We teach our students to let the markets determine which options we decide to trade. What we mean here is we want to buy options when volatility is low and sell them when it’s high. How do we know what’s high and what’s low when it comes to volatility? The way we do it in the Thinkorswim platform is to use the IV Percentile tool. This can be found on the trade page under the ‘Today’s Options Statistics’ box towards the bottom of the trade page. This number compares the current level of Implied Volatility being used to the levels of volatility that have been seen on that product over the last 52 weeks. Anything above the 50th Percentile means Implied Volatility is high while any reading below the 50th Percentile means Implied Volatility is low.

The reason we like to let volatility guide us is we are taking the view that over time the 50th Percentile will act as a magnet and will pull volatility towards it. When the volatility is high we will go to the premium collection strategies in our playbook. This includes selling vertical spreads which is one of our favorite strategies. When Implied Volatility is high and we sell premium we are actually increasing our odds of success if volatility drops. This happens because as volatility drops the options will get cheaper, which will allow us to close our short premium trades for more profit. It’s giving us more ways of being profitable.

When Implied Volatility is below the 50th Percentile we will focus on buying premium. This is the case because if we get volatility to expand higher towards the 50th Percentile that will actually help our options increase in value faster.

If you can program yourself to follow volatility closely you will vastly increase your chances of success. Instead of just buying a long call or put on each trade and hoping for the best, you will actually give yourself a better opportunity to make money if the market doesn’t do exactly what you are looking for.

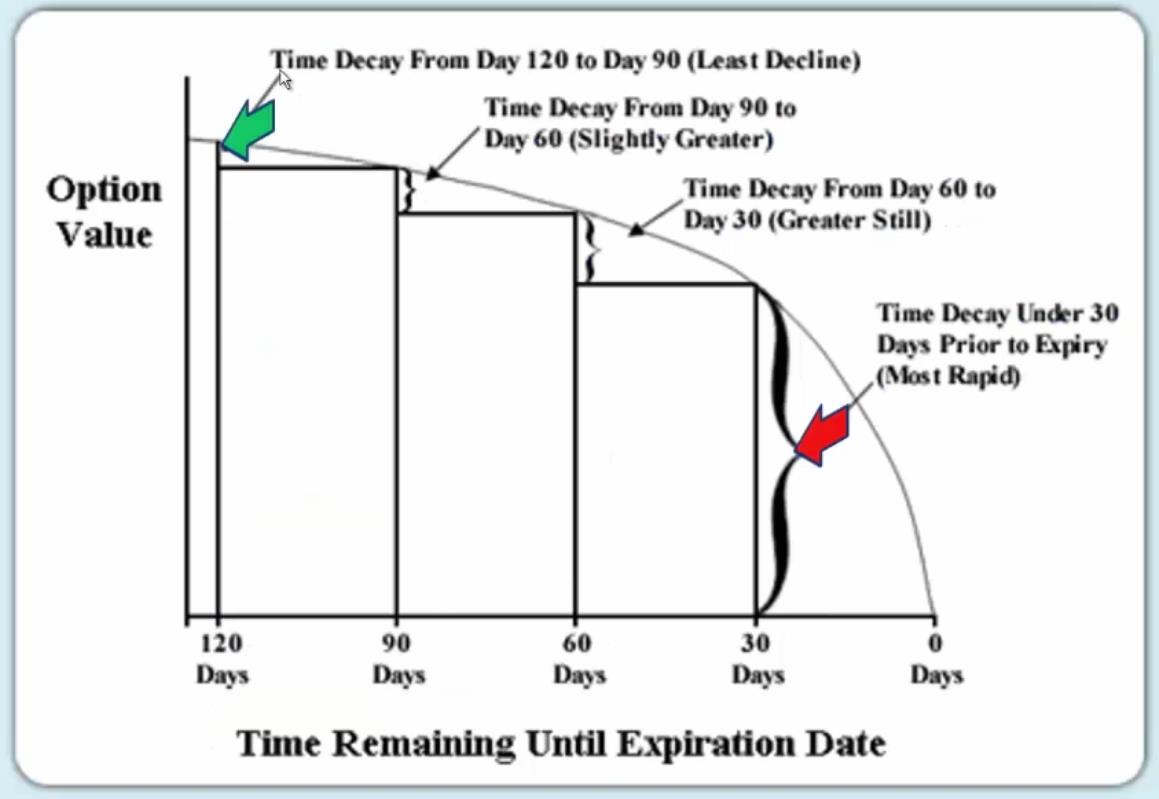
The second input in the options pricing model that many options traders don’t pay enough attention to is Time to Expiration. We know that trading options is much like buying an insurance policy. Each day that we don’t make a claim our policy loses value that we don’t get back. Trading options is much the same way. The longer you hold an option the less value it will have due to the time decay. You can actually limit the effect of time decay by going farther out in time. This is due to the fact that time decay moves in a nonlinear fashion. In other words, the closer you get to expiration the more value the option will lose each day that you hold it.

Knowing this about time decay means we can place trades with better odds of success by going farther out in time. Many traders will look to the weekly options which expire each Friday because they are very inexpensive when compared to the options that expire once a month. However, when trading the weekly options you have to understand the time decay can have a big factor on your trades. Instead of putting on trades that don’t have a large margin for error, I encourage our students to go out 20-40 days at a minimum. This will limit some of the effect of time decay and will allow you to hold your positions longer without the time decay eating away at those positions.

If just blindly buying calls and puts, you are going to face an uphill battle over time with your options trading. Sure you will have some really great winners from time to time but ignoring factors like Implied Volatility and Time Decay will ultimately lead to frustration. It will be hard for you to hit the consistent profits that we all want over time. However, flip the cards around and let these factors work in your favor and I think you will be amazed at how the growth in your account will improve.

3 Options Strategies for More Profits

            1. Long Call or Put

When buying a long call or put, we need to make sure we have a strong opinion on which way the stock or ETF is headed in the near term. We have to keep in mind that whenever we buy an option the clock is ticking the second we decide to initiate the trade. The time decay will start to add up and potentially eat into the profit potential that we have. This means not only do we need to be right on market direction, but the move needs to happen in our favor quick enough.

To combat some of the negative features of buying an option, we like to be very picky with the criteria that we use when selecting the call or put option. First, we don’t pick the option based on what we can afford like so many retail traders make the mistake of doing. In many cases, this will leave you with an out of the money option which has a very low probability of success. Instead, we like to trade the in the money options.

Our criteria has us going out 20-40 days until expiration and buying the call or put option that is 1-2 strikes in the money. This criteria is the same whether we are trading AAPL, BA, or C. By using the same criteria on all stocks and ETF’s, we are able to take much of the discretionary decisions out of the equation.

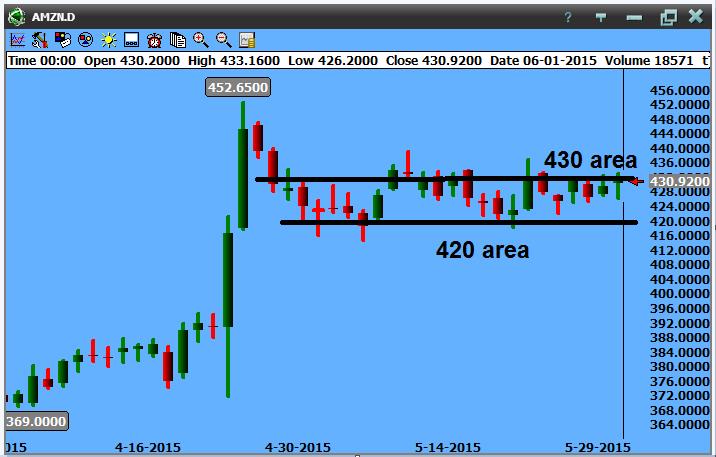
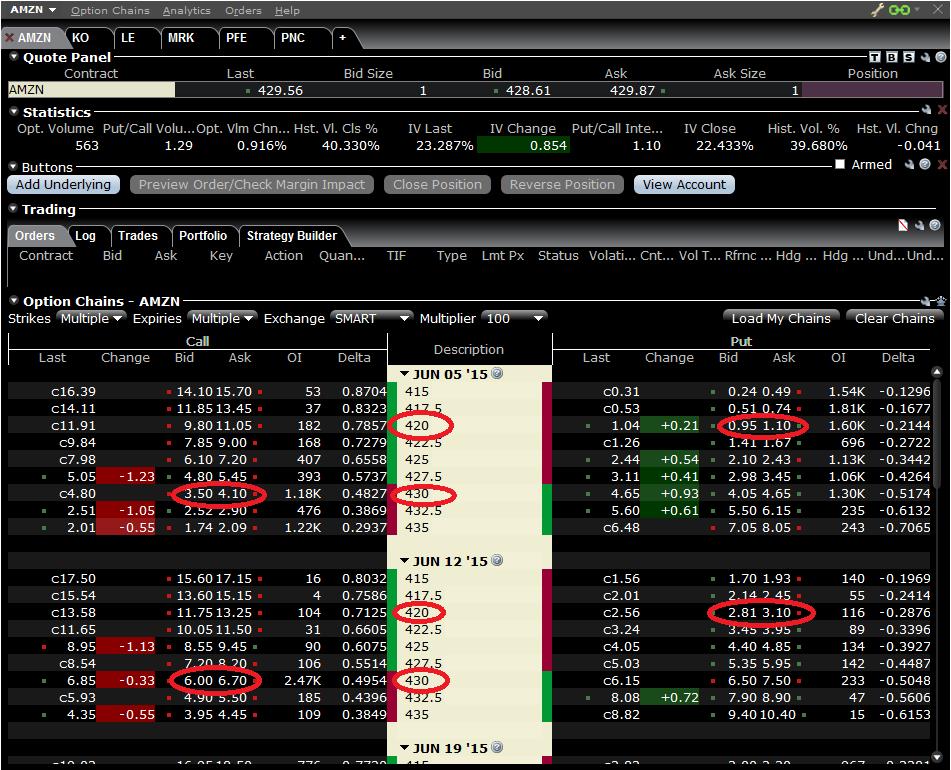
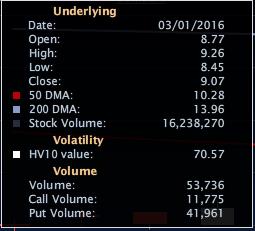
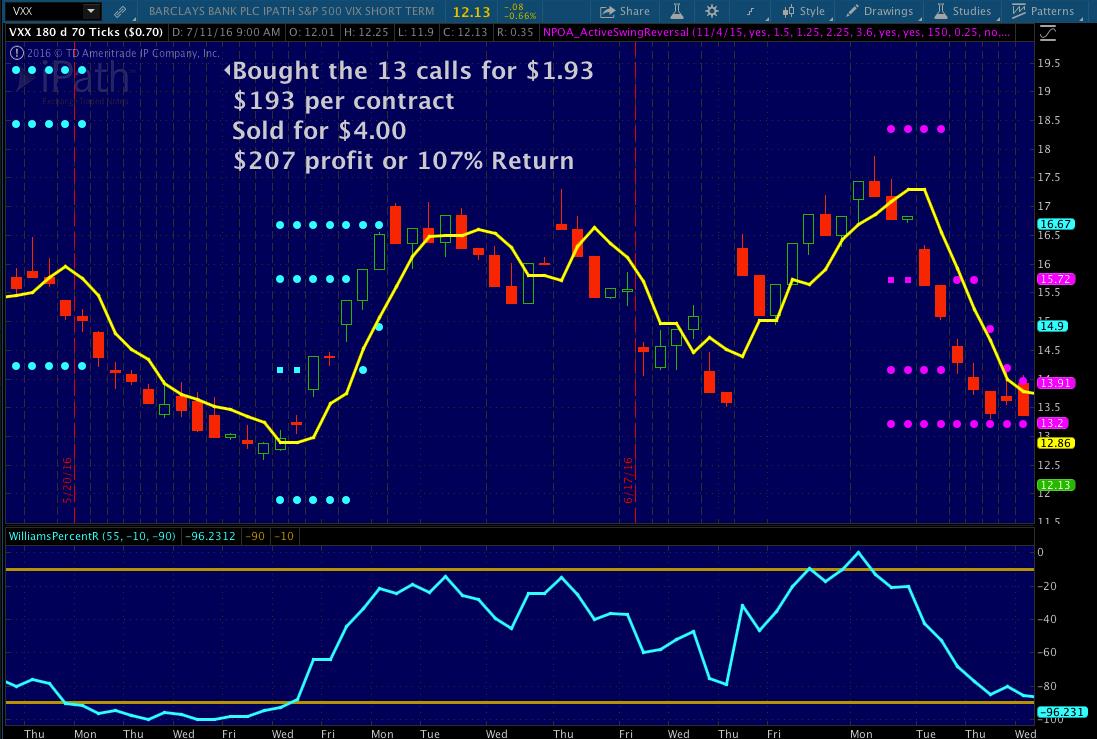
For example, back in June our Options Fast Track system gave us a long setup on one of the volatility ETF’s (Symbol: VXX). The entry point was at $14.15 on the chart. Instead of tying up the capital buying the shares of stock once the entry point was hit, we decided to buy the July 13 call options for $1.93 or $193 per contract. The options had between 20-40 days left until expiration and the 13 calls were one strike in the money from the entry point.

Click Here For More Details On How the Fast Track System Picks Market Direction

For less than $200 we were controlling 100 shares of stock with the call option. This is a perfect example of the leverage that options offer us. Regardless of the account size you are working with, this is a trade that will leave you with very little capital at risk.

We were fortunate enough in this case that VXX did go up and hit our full target at $16.67. Once this level was hit, we sold out of the long call position for $4.00 per contract. This gave us a profit of $207 per contract or a return of 107%. That’s a great profit that can give a quick boost to a small account.

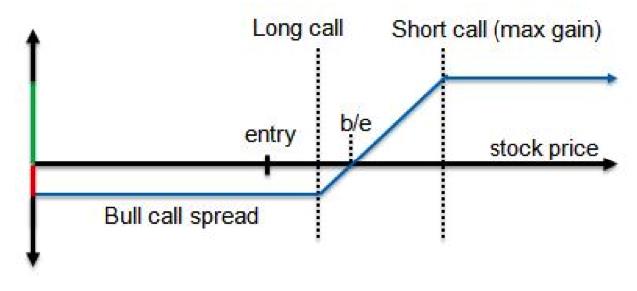
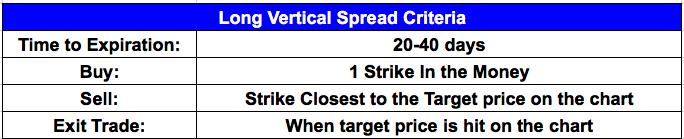
2. Long Vertical Spread

There are times when I want to make a directional bet but do so with a more conservative trade. This is where the long vertical spread comes in. Out of all trade types, the Vertical Spread is my favorite as it is the most flexible strategy when it comes to trading options. When using a long vertical spread, we still need to have a strong opinion on which way the stock or ETF is heading in the near term. While the time decay is still going to be there like with a long call or put, the long vertical spread is able to limit the effect of that time decay slightly.

We like to use the long vertical spread when we are less sure of market direction. We are able to do this because a long spread is constructed by both buying an option and selling an option with a different strike at the same time. Vertical spreads offer a unique ability to control risk and reward by allowing us to determine our maximum gain, maximum loss, breakeven price, maximum return on capital, and the odds of having a winning trade, all at the time we open a position.

>

When setting up a long vertical spread we still like to trade the options that have between 20-40 days left until expiration. We structure the trade by always buying the option that is 1 strike in the money and then selling the strike that is closest to our target for that stock or ETF in the near term. The nice part about using this simple criteria is that it is the same when using call or put options. The criteria is also the same regardless of the symbol of the stock we are trading.

For example, back in June we had our Options Fast Track system giving us a short setup on Tesla (Symbol: TSLA) with an entry point at $227.98. Instead of going in and short selling the shares of stock, which could tie up thousands of dollars or capital, we decided to look at trading the options.

Buying a long put option is one way of playing the market when it is moving to the downside, but it would also tie up too much capital on the TSLA trade (over $2000 of capital per contract). So what else could we do? We decided to look at buying the July 230/210 put spread for $7.45.

This trade had us buying the July 230 put and at the same time selling the 210 put. We paid $7.45 or $745 per spread. We still controlled 100 shares of TSLA stock on the downside but by using the put spread instead of buying the long put we were able to cut our cost by over 50%. This is still a bearish trade so we make money if the stock moves lower. Our risk is limited to the price that we paid for the spread which was $745 per spread. The trade off here is we will be left with a smaller winner if the trade does hit the target on the chart.

In our example, the trade did go down and hit full target on the chart at $212.86. Once this level was hit, we closed the trade by selling the put spread for $11.90. This gave us a profit of $445 per spread or a 60% return.

Here is a great example of using options to open the door to some of the expensive tech stocks for a fraction of the price. Don’t feel like you are backed into a corner trading the cheap stocks because you have a small account size. Use the long vertical spread to go where the action is without tying up thousands of dollars of capital.

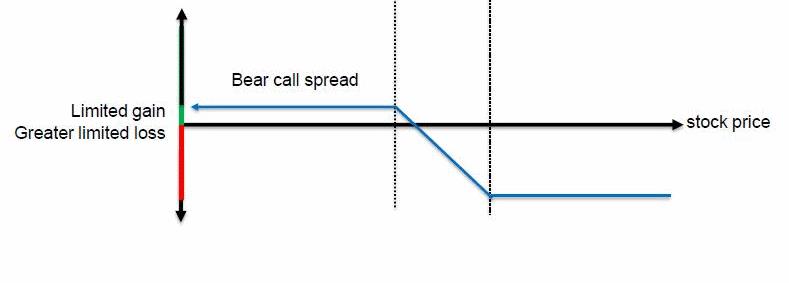
3. Short Vertical Spread

Trading long calls and puts or a long vertical spread give us great ways to put on an aggressive trade when we have a strong opinion on market direction in the near term. What if we are a little less certain of market direction? Selling vertical spreads to open a position can give us a way of scratching out a profit even in a period of choppy price action. We do this by selling an option that is closer to the current price of the stock and then going out and buying an option with a strike price that is farther out of the money. By doing this, we are still able to be in a risk defined position but it also gives us multiple ways of being profitable. Let’s take a look at the criteria that we use when selling a vertical spread to open a position.

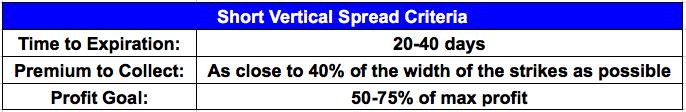
When selling vertical spreads to open a trade we still like to use options with between 20-40 days left until expiration. Why do we prefer to go out farther in time? In most cases the monthly options will have more volume and open interest when compared to the weekly options. This will make them easier to get in and out of trades at good prices.

Going out to the monthly options will also give us more time to be right just in case the market moves against us initially. This gives us time to recover while the weekly options don’t give us that flexibility.

When selling spreads, we like to collect as close to 40% of the width of the spread as possible. For example, back in early June we saw that the Real Estate ETF (Symbol: IYR) was overbought and we felt it was due for a pullback. However, I was less sure on the timing of the move and didn’t want to be super aggressive by buying a put or put spread. Instead, I wanted a trade that would make money if IYR moved lower or got choppy.

We went out to the July monthly options and we sold the July 80.5/81.5 call spread to open the position. This had us selling the 80.5 call and buying the 81.5 call at the same time to make it a risk defined trade. We collected $.38 or $38 per spread to put this trade on. This $38 was the most we could have made on the trade, while our risk was limited to $62 per spread (difference between the 81.5 and 80.5 strikes minus the $.38 collected to put the trade on). Our break even point on this trade was at $80.88 (short 80.5 call plus the $.38 collected to put the trade on).

Why would we risk $60 to make $40? That doesn’t sound like a very good risk to reward ratio. The reason we would like a trade like this is it would allow us to make money 5 different ways:

1.    We make money if IYR moves slightly higher as long as price closes below $80.88 

2.    We make money if IYR moves lower as long as price closes below $80.88.

3.    We make money if IYR moves sideways as long as price closes below $80.88.

4.    We make money as the time decay adds up each day that we hold the trade.

5.    We make money if the implied volatility contracts.

In our case, we were fortunate that IYR did move lower, time decay did add up, and volatility decreased. As a result, we were able to close this trade out by buying the spread back for $.12 or $12 per spread. This gave us a profit of $26 per spread. While that doesn’t seem like a lot of profit, remember we only tied up $62 of capital to begin with. You could have put this trade on 10 times and still had less than $650 of capital at work.

It’s important to note that the criteria outlined above is the same for both short call spreads and put spreads. By having a rule set in place, it allows us to be more consistent and eliminate much of the discretionary decisions that so many retail trades get stuck on.

Selling vertical spreads to open positions is a very powerful approach that many retail traders miss out on. While short spreads are not the holy grail of trading, they give us the flexibility that we need to make money in any type of market condition that comes our way.

Risk Management - Position Sizing

Now that we have 3 options strategies that we can use to take trades right away, the next step is to determine how much risk we can take. One of the biggest reasons for traders failing to reach their profit goals is taking position sizes that are way too big. I hear it all the time from newer students. “If I just hit a few big winners the whole game changes for me.” The approach is completely backwards thinking. When trading with a small account size it’s crucial to focus on consistent growth over time. If you can focus on small winners on a regular basis you will see the power of compounding take over.

I would also much rather see a newer trader take 5-6 small positions instead of 1-2 big positions. With any trading system out there the statistics become more significant as the sample set of trades becomes larger. If you are just taking 1 or 2 trades at a time, it becomes a long shot to see the results you are looking for. However, if you are taking 5-6 trades now all the sudden we can get more diversification built in and also build our sample set of trades larger to make sure the odds are in our favor.

Having a risk management rule in place is crucial to trading success. I have included a sample risk management template below. This is a very similar plan that I use in my own trading.

Sample Risk Template:

Determine what % of your account size you are willing to have at risk.

In my plan I use the 50% number. This rule says I will not have more than 50% of my account size at risk at any one time. If I am using a $10,000 account this means I can’t have more than $5,000 at risk across all my different positions. So I have $5,000 to work with spread across the 10 names on my watch list. If I reach that $5,000 limit and I get new trades to set up, then I need to either close out of some existing trades to free up capital in order to get back below the $5,000 level or skip the trade.

The 50% number works for me and is a level I am comfortable with. That number could be different for you. It could be 25% or 60%. The number doesn’t matter to me as long as you are comfortable with that level of risk and it’s something you can stay disciplined to following.

Initially, you will want to try and keep the risk spread evenly across all the names on your list. Don’t let one name on your list dominate your P/L. For example, trading one contract on GOOGL is not the same as trading one contract on C. In this case the outcome of the GOOGL trade will dominate your P/L.

The risk doesn’t have to be equal to the penny across all your trades but don’t let it get too far out of line. Overweighting certain sectors from time to time will work fine as long as you are comfortable with the risk. Never get into the situation where the outcome of one trade impacts your ability to take the next trade. Remember, we are looking for consistent long term success with our trading.

What’s the takeaway?

As traders we want to be as diversified as possible. This means a diversified list of products on our watch list, but also a diversified list of trade types as well. We all love to trade the long calls and puts as they give us a ton of profit potential quickly on any big market move. However, we also have to realize that the market doesn’t always move for us. So we want to make sure we have safer trades on like a short vertical spread which will allow us to make money if the market stays slow and sideways. Don’t limit your trading to the basic strategies just because you are working with a small account size. There are great trades that you can place with very little capital that will allow you to stay active in all market conditions. The more you mix up your trade types the more consistency you will see in your results long term.

THE SPECIAL OFFER

Learn how to trade options the NetPicks way with the Options Fast Track Hot List. This list covers our favorite markets that we trade each and every day. These are the stocks and ETF’s that we have seen the very best results with over the last 10 years.

Click on the link below to access the full list free of charge along with complete training on how you can use these tools to setup your own go to watch list of products. Take the discretion out of your trading and start looking at the markets like the pros do.

Click Here for Full Access to the Fast Track Hot List Training

ABOUT THE AUTHOR

Mike started trading back in 2002 as a finance major in college. It was quickly apparent during one of his first business classes that there was great wealth to be made in the stock market. Not one to be patient and wait for his degree to start making money, Mike discovered the great leverage that can be used in the options markets. This allowed him to start trading options with a very small account size while still in college.

Mike found success early in his trading career and decided to take the leap into full time trading soon after. Along the way, he had to learn many lessons the hard way like so many retail traders can relate to. It wasn’t until a visit to the floor of the CBOE (Chicago Board Options Exchange) that he realized he had to put a system in place that he could stay disciplined to.

Mike discovered the NetPicks trading systems back in 2006 and quickly became a customer. This was the missing piece to the puzzle. This has allowed him to trade full time for a living ever since. After learning the systems inside and out over the span of the next 2 years, Mike joined the NetPicks team as a trading coach in 2008. He quickly became the resident options expert and has been Lead Options Instructor ever since. While he has dabbled in other markets over the years, trading options has become his go to market. Mike has worked with thousands of traders since 2008 and enjoys the opportunity to help others reach their trading goals.

Chapter
02

OPTION STRATEGIES FOR SMALLER ACCOUNTS

By Todd Gordon, TradingAnalysis.com

Most traders starting out usually begin with a small account. In this video, I am going to assume that you have a basic understanding of how options work, and then I am going to show you some very simple strategies that have worked quite well for me in my years of trading options.

So we are going to hit the ground running while I show you strategies that I trade each day with my own money. I set up my trades using a disciplined approach where I manage my money.

There are 3 main goals to trading a small account:

  • You need to be extremely diligent in protecting your account
  • We want to take our smaller-size account and grow it into a medium or larger sized account, so we have a little more wiggle room in our trading.
  • The goal to trading and growing a small account is efficient use of buying power in margin. You want to utilize the best strategies to maximize the limited resources you have on hand.

So, let’s get started, and I will walk you through several ways to trade a small account with options.

THE SPECIAL OFFER

See Todd’s free video on How I Find the Best Option Trades with Fibonacci!!

SIMPLY CLICK HERE FOR YOUR FREE COPY!

ABOUT THE AUTHOR

Todd Gordon is originally from upstate New York, the Saratoga / Lake George area. His career as a trader started back in college when he first fell in love with the game. He opened an eTrade account and spent his summers day trading around his job on the golf course.

He attended college at St. Lawrence University in upstate NY where he majored in economics and competed on their NCAA Division I ski racing team with several future Olympians. Following college he packed the car and drove cross-country to the beach in San Diego, CA and took his first professional trading job. He learned to trade professionally from a proprietary equity trading firm in San Diego. In 2004 he packed up the car and drove back east and headed to his first job on Wall Street in New York City.

His career continued to grow and Todd became a Senior Technical Analyst at Forex.com on Wall Street followed by a stint as a trader at Gain Capital Asset Management, again on Wall Street and a partner in a Research and Trade Advisory Business. He is a regular contributor on CNBC, with more than 300 appearances, and he is currently in his second, three-year contract with NBC Universal.

Todd founded his company, TradingAnalysis.com, where he focuses on educating others to become consistent in their trading. He is happily married and a proud dad of twin boys.

Chapter
03

The Most Lucrative Options Trading Tool The Pros Use (But Don’t Want You To Know!)

By Larry Gaines, PowerCycleTrading.com

Ask yourself this, “What if you could add a free, simple, but powerful tool that can gave you a winning edge to generate a consistent trading income”? A tool that can significantly increase your probability of winning trades?

That is why I am offering you a very powerful tool for free that you can start using today. If you are already using this tool and know how to use it, I hope to be able to further your knowledge and thus your use of it with this guide, so you can become a better trader…an expert trader!

Not only can this information be used to help you generate more option trading income, but not using this tool can lead option traders to making the number one trading mistake, which I definitely want you to avoid.
Knowing what NOT to do can be just as important as knowing what to do. So, I will should you that as well.

Options trading has many more advantages than trading stocks, but is more complicated. For an individual trader, options can be a little intimidating, as well. That is why many investors trade options by purchasing out-of-the-money, short-term options, since they cost less than long-term options and it is simpler to trade them.

For example, out-of-the-money calls (those are options where strike price is above the stock price) are especially popular because they are cheap, and seem to follow the old Warren Buffet paradigm we all love- buy low, sell high. But is this always the best option strategy?

Imagine you are bullish on Facebook (FB) trading at $100. As a beginning options trader, you might be tempted to buy calls 30 days from expiration with a strike price of $120, at a cost of $0.15 or $15 per option contract. The reason most traders do this is because they can buy a lot of them. Now, let’s do the math.

Purchasing 100 shares of FB at $100 would cost $10,000, but for the same $10,000 you can buy 666 contracts of $120 calls and control 66,600 shares. WOW! Just imagine that FB hits $121 within the next 30 days and the $120 calls are not trading at $1.5 or $105 per option contract, just prior to expiration. You would make $59,940 in a month on a $10,000 capital.

At first glance, this kind of leverage is awesome, but do not let this glitter fool you because not losing money is just as important as making money!

One problem with short-term, out-of-the-money options is that you not only have to be right about the direction of the stock move, but you also have to be right about the timing. That ratchets up the degree of difficulty, as to make a profit, the stock doesn’t just need to go past the strike price, but also must do that within a defined period of time. In the case of the $120 calls on FB, you will need the stock to reach $120 within 30 days to make a profit.

This dual objective of having to be right on the direction plus the timing really lessens the probability of an option trade being a winning trade when buying those.

Everything that I teach my clients s based on the managing risk and increasing the probability of winning trades. In the FB option trade you are wanting the stock to move more than 20% in less than a month and this would be a two standard deviation move and not many stocks are likely to do that. In all probability, the stock will not reach the strike price and the options will expire completely worthless.

Based on probability, using standard deviation, there is only about 5% chance for the stock to reach $120 to $121 by expiration. So in order to make money on an out-of-the-money option, you either need to outwit the market or get plain lucky.

Being close means no cigar. Imagine that FB rose to $110 during the 30 days of your option’s lifetime. You were right about the direction of the stock move, but since you were wrong about how far it will go within that specific time frame, you would still lose your money. And this is outright painful!

Based on this trade example, a better goal for every trade can be to select trades based on what provides the most consistent positive returns, not a one-time, big winner. Consistency is derived from making high probability trades based on reliable data and facts. Where there is a big disadvantage, such as the one you saw in the FB option scenario, you can usually just look at the flip side of the coin and see an equal and opposite advantage.

In this case being a seller of options gives you a huge advantage over being a buyer of options. All the pros know this and take advantage of it, and so can you. As a seller all of the details in the FB example stay the same, but in your favor, instead of against you.

This is why professional trades look first to take advantage of selling options for profit generation and hedging.

By selling options, we are in essence selling time:

·         This strategy creates a powerful dynamic

·         It is yours for the taking

·         An options is like a coupon that has to be redeemed by an expiration date or else it is no longer valid.

HOW TO DO IT AND WHAT IS INVOLVED

The most important option factor for income generation is understanding the concept of time and that is pretty simple as you just saw.

Time value is used for trading strategies that take advantage of the accelerated time decay on an option into its expiration. Options income strategies are very tied to time value and the impact it had on the price of an option. It is that simple and you can use this information to make money.

WHAT IS TIME VALUE?

Time value (TV), the (extrinsic) value of an option is the premium a rational investor will pay over its current exercise value (intrinsic value), based on its potential to increase in value before expiring. This probability is always greater than zero, thus an options is always worth more than its current exercise value.

Take a look at the following chart to see just how predictable and powerful this option-time paradigm is and answer one simple question.

This chart represents the time decay concept in options trading. In the 120-90 day period the time decay is very small. Then, as you get closer to expiration, you can see that the time decay really accelerates. I call this turbo time decay and before you know it, your option can be worth zero.

So here is the question…If the underlying security price was to go sideways, having no directional trend, would you have wanted to be long an option 120-90 days out, or would you have rather sold an option?

While there is some slight variation, this is the common natural time value progression for all options. And it is seriously like falling off of a cliff, blindfolded.

The free tool for determining the actual time decay of an option is called Theta, which is provided on your brokerage platform.

Theta helps you know how much an option’s premium is decaying each day. For example, a Theta of -.01, indicates that the option’s premium is decaying by $1 a day. Of course, Theta changes over time and increases the closer the options gets to its expiration date. So you can see how important this date can be for options traders. And that is it, simple but very powerful when used correctly. Use the information provided by a Theta to check how much your options are decaying each day, if you own any at this time.

The following is an image of the Theta display from the Think or Swim trading platform. Getting Theta usually involves just a simple click on your brokerage platform.

So this example is Apple (AAPL) and you can see the days to expiration are 10. If you look at the Strike Price column and go down to the 114 mark (see green arrow) and then across under the Calls section, you can see that the Theta value is -.06 (also marked with a green arrow). This practically indicates that the value of the option in question is going down by $6 a day per option contract.

You can see how you can increase your skills using Theta as a seller of options to stack the probabilities way in your favor when generating income by selling options instead of paying for them. 

The most common strategy is selling options, naked calls or puts, but this is not a hedged approach. You can easily reduce this risk, or hedge it, by purchasing long options to offset the un-hedged risk from selling options naked. While hedging reduces the overall returns, it is much like having an insurance and it is worth that cost for risk management.

Selling options takes advantage of time decay and there a number of great options trading strategies that can generate consistent income with limited risk. Return can still be significant, even with hedging protection, since many options strategies (such as a properly structured credit spread) can have probabilities of over 70% of success, even without the aid of technical analysis, which can then increase your winning probabilities even more.

The most popular hedged options income strategy that can be used regardless of the market direction is the credit spread. This strategy takes advantage of the time decay to make money while also reducing risk.

You may be wondering how to select the right income option strategy. The goal of every trader should be to select trades based on what provides the most consistent positive returns and not always the greatest. And one of the best ways to achieve this is by knowing the income option strategies that are available and then selecting the one that is the best for your trading style, trading plan and lifestyle.

Here are some of the types of income strategies you can choose from:

  • Covered calls
  • Calendar spreads
  • Diagonal spreads
  • Long iron condors
  • Credit spreads

My favorite income option strategy is the credit spread for 4 main reasons and those are:

  • It can work regardless of market direction
  • It almost always works even if you are wrong
  • The probability is over 68% even without adding technical analysis, which increases the probability even further
  • It is perfect for hedging

There are 3 types of credit spreads:

  • Bear call credit spread
  • Bull put credit spread
  • Long iron condor

Bear call credit spread is best of you think the market is probably going to go down. The strategy involves selling one call with a lower strike price, while simultaneously buying one call with a higher strike in the same month.

The bull put credit spread is best when you think that the market will probably go up. The strategy requires that you sell one put while simultaneously buying one put with a lower strike price in the same month.

The long iron condor is known for being a non-directional, low-risk trading strategy. To execute it you can combine a bull put credit spread and a bear call credit spread together.

Let’s review what we have learned thus far:

  • You can sell options whit a much higher probability of success than you can buying options
  • Theta is a free tool on your brokerage platform that you can use to check time decay
  • Selling options strategies can be hedged or not hedged, but hedging lowers risk while slightly lowering your returns
  • Credit spreads are popular income generating strategy that capitalizes on option time decay with controlled and limited risk

Would you like to learn more about these option strategies that capitalize on time decay? You can do this now by taking advantage of the special offer featured below.

THE SPECIAL OFFER

Get my free “Make Money Trading Options e-book” Plus Weekly Access to my Trading Videos Completely FREE!

THE MOVIE

ABOUT THE AUTHOR

Larry Gaines has become one of the leading coaches for successful traders and investors. He continues to develop and host, every month, new trading educational programs to help traders and investors generate greater income from their investment capital with less risk exposure. 

He founded PowerCycleTrading.com and the Power Cycle Virtual Trading Room following over 30 years of professional trading experience in the commodity and equity markets. 

During his tenure as head of an international trading company that often traded a billion dollars worth of commodities in a single day, he learned first-hand the necessary elements of a successful trading system and the use of options.

Using this in-depth knowledge and experience, Larry developed the Power Cycle Trading™ Model to allow for greater profits with a more disciplined, systematic degree of trading success.

Chapter
04

Minimize Risk and Maximize Gains with Options

By Geoffrey A. Smith, DTItrader.com

There are many ways to trade options or use options in trading.  Many people trade options for the sole reason that they are much cheaper than trading stock.  It is kind of interesting that it is rare to find an options trader that would ever buy a stock, or a stock trader that would ever buy an option.  I believe that both camps are wrong.  You need to be able to trade both, or at least take advantage of both.  The reason for this is that if you trade stock, you can minimize risk and maximize gain using options.  If you trade options, you do not get the full benefit of the stock’s move if you are right, and you “run the risk” of being assigned the stock, which scares option traders, and it shouldn’t.  I’m not going to get into the fundamentals of options, but let’s digress for a paragraph or two to get some understanding before we talk about the strategy I want you to learn.

Buying is the opposite of selling.  Long is the opposite of short.  Bull is the opposite of bear.  There are only two things that matter in options; if buying an option, it must go beyond strike (in the money) for you to be paid on expiration day, and if selling an option short, you can end up long or short the underlying stock at the strike price.  If you keep these two things in perspective, your option trading will go a little smother. 

If you buy a call option, you are buying a right, not an obligation, to purchase a stock at a specific price (the strike price) on or before a specified date.   When buying a call option, you want the stock to go higher.  If you buy a put option, you are buying the right, not the obligation, to sell a stock at a specified price on or before a specified date.  When buying a put option, you want the stock to move lower.  Now the opposite side.  If you sell a call option (going short the option) then you are selling the right to buy to another party, and if they exercise their right to buy, you must sell to them (you are taking on an obligation) and you could end up short the stock unless you already own at least 100 shares of it.  Selling a call option when you do not own the stock is called a naked call, but if you own the stock it is a covered call.  If you sell a put option, then you are selling the right to sell to another party, and if they exercise their right to sell, you must buy from then.  If you are short the stock, you will buy it back (this is a covered put), but if you are not short the stock, then you could end up long the stock.

Now that we have that out of the way, let’s use these concepts to try and make a little money.  Let’s make the assumption that we want to buy a stock.  Let’s pick an expensive stock to prove a point and then we will look at a “normal priced” stock.  Everyone has heard of Amazon, so we will start with it.  Below is a daily chart of Amazon (AMZN).  You can see back in April when their earnings came out.  Notice since then that Amazon moves down to the 420 area and then back up to the 430 area.  So let’s say we want to buy AMZN when gets back down to 420.  Now we can put a buy limit, good till canceled, in and wait for AMZN to sell back off and exercise our limit order.  Then when it gets back up to 430, sell it and make $1000 for every 100 shares we buy.  If we buy the stock, we will need to put a protective stop below 415 (notice that is the lowest it has been since earnings), so we will risk about $500 to make $1000.  Nice trade, pat yourself on the back.  Now let’s do it using options.

Daily AMZN Chart

Same trade with a twist.  Instead of putting in a buy limit, let’s sell a 420 naked put option.  Now this does two things; a) if AMZN gets to 420 or lower at expiration, you will end up long the stock (that is what is desired in this case), and b) by selling a put option, you will bring in money.  In other words, the market is going to pay you to place a buy limit on a stock (that is pretty cool)  Below is an option chain for AMZN.  Based off the chart, AMZN is trading at 430.92, so AMZN is going to have to drop 10 points to exercise us.  So it would probably be good to wait a while before selling the put to get more premium, but since we cannot put extended time in an article, we will use what we have (the concept is the same).  Look at the Jun 12 ’15 options.  The 420 put is selling for around 3.00 (midpoint between bid and offer).  So if we put an order to sell at 3.00 and are filled, we will bring in $300 of credit.  If by June 12, AMZN does not get to 420, we keep the $300 just for trying.

Note: if AMZN drops to 420 from 430, the put option will increase in value and your account will show that you are losing money on the option.  This is not the case unless you buy it back at a loss.  Remember the end game, you want to be long the stock from 420.  AMZN will have to be below 417 for you to start to lose money (420 – 3 (premium brought in from the sold put) = 417.00).  Let them exercise if they can, that is what we want.

If we get exercised, then we will put a stop below 415 and 414.89 (just below 415 by a little bit), Risking $511.  We will then sell a 430 covered call and probably get another 3.00 or so.  So total premium brought in will be $600.  If AMZN drops and stops us out, we will need to buy back the covered call (that now has turned into a naked call), but since AMZN has dropped, the call will decrease in value and we will probably be able to buy it back around 1.00 or so.  So we get $500 in premium and lose $511 on the stock for a total of $11 loss.  Now, if AMZN goes up, and we get called away at 430, we get $1000 off the stock and $600 off the options for a total of $1600.  So in this case, we are risking $11 to make $1600.  Which scenario do you like best, a 1:2 risk/reward or a 1:145 risk reward?  This is the luxury of options.

AMZN Option Chain

AMZN is a bit extreme since it is an expensive stock and is quite volatile.  Let’s go to the blue chips and grab a stock like Caterpillar (CAT).  Below is a daily chart of CAT.  Notice it has support around 85 and resistance around 90.  Next support is around 83, so we will use 82.89 for a stop if we get filled.  Using the same technique let’s look at selling the 85 put.  In the option chain below, the 85 put is going for around 0.75.  Again, if it does not get there we get to keep the $75 and try again.  If we get exercised, we place the protective stop at 82.89 and sell a July covered call at 90 for around 1.50.  There are weekly options on CAT, however, we want to be able to finance the protective stop the best we can.  By going out to the monthly option, we can get there.  If we add the two options together (0 .75+1.50=2.25) we will bring in about 2.25.  If we are long from 85 and need to risk to 82.89, we risk 2.11 on the stock.  The premium we bring in will cover the protective stop.  If we get stopped out, we buy back the short call and will probably lose around $25 or so depending on how much time is left in the option.  If CAT moves up and we get called away at 90, we pick up $500 from the stock and $225 from the option premium for a total of $725.  Again we can have the standard 1:2 ratio, but the 1:29 ratio of this trade seems much better.

Daily CAT Chart

CAT Option Chain

We do have to throw the glass half empty theory in here since there are those who are pessimists and will ask, “what if CAT is at 80 when you get exercised, or what if AMZN is at 410 when you get exercised?  What will you do then?”  You’ve got to love those people.  First, panic never solved anything so please get that out of you mind.  But think about it very quickly.  We did bring in premium when we sold the put, so we have reduced the risk somewhat.  Next question is, if you just put a buy limit in and is sold off to that level, what would you normally do?  You could sell a covered call at entry (85 on CAT or 420 on AMZN) and if you get called away, then you will make nothing on the stock but get to keep the premium from the options, still not losing anything.  You could sell at the money calls and it will reduce your loss considerably, especially on AMZN but not as much on CAT.

Another thing, what if you end up long the stock, it does not stop you out, but is not called away from you.  Even better in my opinion.  You brought the money in from the naked put and the covered call, and now you get to sell another covered call.  Before selling the same strike price, however, look at higher strikes, you may be able to get the same premium as before if the stock has moved higher.

There are many ways to scan for stocks.  Many have their own favorite stocks that change over time.  You will find some stocks that do not have options.  I do not like stocks that don’t have options for the simple reason that I cannot minimize my risk and maximize my gain.  The key is to trade stocks that have some volatility so that the option premium is higher.  Coke (KO) has options but since the stock does not move much the option premium is low and therefore you cannot finance the protective stop.  Below is a scan for stocks out of the DTI RoadMap software.  It scans for optionable securities that are between $50-$600, and are recommended buys/sells between June 3 and July 31 (it is sorted buy highest P&L).

Starting in the middle to the end of June, stocks begin to move again after the “when in May go away” occurrence is over.  Look at the Standard Deviation (Std Dev) column.  The higher the standard deviation, the more volatile the stock.  So I will look at these to see if they are trending with the overall markets, and if so then they are prospects for trading.

Market direction is also important.  You can do this same strategy on the short side  as well.  When markets are bearish like we saw back in 2008-2009, selling calls many times did not get exercised, however, if they did, then sell a covered put to use the premium to finance the stock.  But direction is important.  First look at the year open, month open, and week open, and compare it to the current price of the stock.  If the stock is above all three it is strong, if below all three it is weak.  If it is between some of them then look at the indexes (S&P, Dow 30, NASDAQ) and see if they are doing the same.  If they are, then wait until a clearer picture can be seen.  Below is a chart of the S&P and 3M.  Notice on the right chart that the S&P is above the year, month, and week open.  However, 3M is below the year open but above the month and week open.  If the market falls from here, 3M would be a good candidate to sell calls on and see it drop.  But the S&P will need to begin to drop and take out some support levels before doing that.

S&P and 3M chart

The same can be done for futures contracts if you have experience with them.  I like using options on bonds to help pay for the utilities each month.  Utilities, no one likes to pay for them, but they are necessary.  To help pay for the utilities, trading bond futures options seem to work well.  Let’s discuss bond futures and their options a bit before we get to trading them.  Bond futures are a commodity that trades in 1/32 increments and are worth $1000 per point and $31.25 per tick (1000/32 = 31.25).  It controls a $100,000, 30 year US treasury bond.  It is traded by the bond price, not the interest rate of the bond, though, it is interest rate sensitive.  So if interest rates go higher, bond price goes lower, and if interest rates go lower, bond prices go higher.  Bonds open at 17:00 and close at 16:00 CT. The price is displayed in decimal form or with a dash; 147.23, or 147-23, and sometimes 147’23.  The 23 is in 32nd.  So the price is 147 and 23/32.  If you multiply that by 1000, the bond is worth $147,718.75.  Par value is $100,000, so in this case you would be paying a $47,718.75 premium.  Economic new will affect bonds, as they look for inflationary (rising interest rates) or deflationary (falling interest rates) indications.

Options on bond futures trade in 64th increments.  They trade as long as the bond futures are open and trading, so you can actually get out of your trade in the middle of the night, if need be. They are still $1000 per point but since they are half of a bond future tick, then they trade $15.625 per tick.  The option are no different than equity options except the price per point/tick is different and you are only controlling one bond futures contract, as opposed to 100 shares of stock.  You will also notice that the strike prices are every point.  This should give us enough back ground to discuss the Utility trade.

There are weekly options on the bonds.  Some platforms only offer the monthly options, so beware of that.  We are looking for income, so we will be selling the options to bring in premium.  We want the option to deteriorate over the time of the option.  So if we sell a bond option at 16 (16/64) we will bring in $250.  If we buy back the option at 5 (5/64), we pay $78.125 for it.  The difference is the profit, 250-78.125 = $171.875.  If we do this 2 to 3 times per month, this will generate $400 - $500 per month, per contract, to help pay the utilities.

To set up the trade, first we don’t want to risk more than $300 per contract in any trade.  So if we sell an option at 16, then if it doubles or goes 19 ticks against us, then we will get out of the trade.  If using weekly options, we will not be bringing in much premium, so we will look for something between 10 and 20 ticks on the options ($150 - $300), and look to get out between 0-5.  Next we need to look at the trend of bonds.  Here is a daily chart on the ZBU5 (September 2015, 30yr Treasury bond future):

Notice bonds are in a downtrend.  So selling call options will be the safest play since bonds will have a tendency to go down.  We will try to sell options at the resistance point (R1 or R2).  Of course, the closer it is to the resistance point the more premium that will be brought in and the further away from that point brings the least premium unless we go out further in time.  If your platform only does monthly options, then I’d use resistance point further back, but if using weekly options, use the closest.  Another thing to keep in mind, find out when the big economic news is coming out since bonds will react to it.

Look at the option chain below. Our R1 is around the 154 strike.  The Jun 12 call option is trading at 12/64.  The 156 is at 4/64.  The 156 is around the R2 on the chart and a little less risky since bonds have to decline another point to get to that strike.  So you have to make a decision on which option to sell.  Let’s be a little more risky and do the 154 strike.  The current bid and offer are 11/64 – 13/64.  If we put an order to sell at 12/64 and get filled, we will bring in about $187.50.  If today is June 3 and bonds are trading at 149-28, we will have to wait 8 days for the option to expire.  As long as the bond futures stay below 154-00 then the option will lose value each day.  If there is a big economic news day next week, we will need to either get out and take the profit we have, or be ready to exit if the bonds drop off the news.

Doing this trade a couple of times a month can cushion the blow of the bills that come once a month.  We can’t win them all, but remember, we will not risk anymore than $300 per contract.  So one loss will scratch one win and a half for the most part.  If you have never traded options on bonds, paper trade it for a couple of weeks to see how it goes.  Once you get the hang of it, start paying some bills. 

We have walked through a couple of ways to bring in a little income and reduce the risk by financing the stops.  Buying equities is a good thing, but being able to gain more on the position from using options can help boot the account.  If we expand to trading options on futures, we can help pay those utilities a little and have more for the grandkids when they come over.  Remember that there is always risk in trading and we will not ever be 100%.  But taking a little loss is not so bad when the return is much greater.  Good luck trading!

THE MOVIE

CLICK HERE TO INSTANTLY VIEW the video discussing the trade in this article!

THE SPECIAL OFFER

Register for our next FREE event here! During the class you will learn about:

  • The 3 Reasons Most Traders Lose Money
  • How To Solve All 3 Of These Hurdles
  • A Step-By-Step Trade Setup That You Can Start Using Tomorrow
  • And Much More

Reserve your seat and recording here!

ABOUT THE AUTHOR

Geoffrey Smith teaches Level 1, 2, and 3 core curriculum classes, regular educator and instructor on the 24-hour Educational TradeRoom, GPS Coaching, and one of Tom Busby’s first students.

An active trader and investor for 25+ years, Geof focuses in futures, equities and option trading including trading commodity option futures. Geof took an instrumental role in developing the DTI Method. The Platinum Experience core level classes took first place in SFO Magazine and Trader Planet’s STAR awards in the best trading courses category. Before coming to DTI, Geof was a pipeline engineer working in Oklahoma and Texas.

Chapter
05

Putting the “Short Squeeze” on Options

By Mark Sebastian, OptionPit.com

One of the most profitable ways to trade is to spot a short squeeze in a stock, commodity or index.  They happen somewhat often in individual names, less often in commodities, and rarely in an index.  Thus we are going to concentrate on looking at stock short squeezes that happen extremely often.  In this chapter I will discuss what a short squeeze is, how to spot one, and finally how to trade a short squeeze using option trades in the simple form with a follow up in the form of a video that walks through a complex option approach.

What is a short squeeze?

Think of a name that makes no sense to the average trader. The valuation of that company is WHAT??? “So what?” traders might ask themselves. The trader reads online that the company is grossly overvalued based on where the company’s revenues and growth are at “current levels.”  However, there are pundits and “fanboys” that are ecstatic about the name.  “What this company is doing is creating a totally new space that will change millions of lives!” The long side might say, sometimes, but rarely, this explanation is right. Think of names like Facebook or Amazon that have faced doubts and proven themselves to be worth the hype. More often than not, though, the nonsensical valuation turns out to be true. 

Thus, a short squeeze is really created by two sides; on one side is a fundamental, if nonsensical demand for the company’s stock. This side truly believes in the vision and is willing to buy the stock up on this vision. On the other end is the widespread fundamental view that the company is not worth its current trading price and should be significantly lower. The result ends up, typically, crushing both sides of investors and making traders a lot of money if they know how to trade it.

Now that we know the fundamentals behind a short squeeze, let’s discuss what causes the squeeze to happen.

It all starts with stock loan. Recall the basic definition of a short selling (or shorting) from Investopedia:

Thus, basically a short seller is selling stock that he or she doesn’t own, but rather borrowed. This is where things get interesting. The process for borrowing stock is not as simple as it might seem. Here are the steps:

  1. Have a portfolio margined account with a clearing firm that will allow me to engage in borrowing stock (no easy task especially given new regulations);
  2. The trader tells the clearing firm that he or she would like to short stock XYZ;
  3. The clearing firm then finds a “locate” on the stock, matching the short seller to someone that is willing to loan out his or her stock (this is where things get tricky);
  4. If the stock is widely available, the clearing firm lets the trader borrow the stock, the stock is sold, the net proceeds are placed in an interest-bearing account;
  5. If the stock is NOT widely available, the clearing firm may charge a short rate on the stock. The short rate can be more than 50% of the value of the stock. The higher the rate, the less stock is available to loan. These types of stocks are called hard to borrow;
  6. Hopefully the stock goes down;
  7. The trader covers the stock he or she bought, and returns it to the loaner.

Step 5 is where things can go off the rails, and step 5 is what creates a short squeeze. Almost unilaterally, stocks that are hard to borrow are the ones that create short squeezes. To the point that if a stock is easy to borrow, I do not bother looking for a short squeeze set-up as they are so few and far between.

The Short Squeeze

If traders truly believe that a stock is toast, they typically do not mind paying the short rate on the stock because they are very certain the stock is going to go down. However, the danger is in that it means there are very few shares to borrow. Worse yet, clearing firms do not operate fairly. If a trader does a ton of business with the clearing firm or has more money with them, the trader’s access to stock will be better than a less profitable customer. This puts the short in a position to get beat... badly, creating the squeeze.

The squeeze begins with the trader getting a phone call that he is “on the hook” for short stock. This means that a customer that was loaning out shares is considering selling his or her position. “On the hook” means I might get my short position taken away from me. In this case I have two options:

  1. Cover the stock myself and return it;
  2. Close my eyes and hope I don’t get bought in by the clearing firm.

Typically most people would rather choose the former. This increases buying demand in the stock, typically driving the stock higher. At the same time, the general public and day traders start buying up the stock as it is now a hot stock and a mover. They may or may not put their stock up for loan. The stock being higher typically causes the customer to sell rather than hold, and the stock that was loaned is off the market, met with typically less supply. Given the rally in the stock, others step in to try to sell the rally in the name, or the trader moves to sell the stock the next day again. Thus, the supply of stock to borrow is lower and the supply of short traders is higher.

 This can turn into a nasty cycle of a stock moving higher and higher and higher. Especially because smart firms can take supply off “borrow” and not actually sell the stock. At the end of the squeeze, all of the short stock sellers that do not have the capital to stay short cover the stock. The stock can double its price or more...thus crushing the shorts. Then, the squeeze over, the firms that took their stock off loan dump the stock.This crushes the guys that jumped into the hot stock as the underlying drops and drops and drops—ypically below where the short squeeze begins, until all of the hot stock longs are out…thus crushing the uninformed longs. 

Spotting the Short Squeeze:

The short squeeze is easy to spot from a chart perspective. If one is looking for them to trade, start by asking your broker for a list of stocks that are hard to borrow and what the rates on that hard to borrow might be. The higher the rate, the harder that stock is hard to borrow. The next piece is to look at the stock’s daily volume.

In this case we are looking at Transocean: RIG

Source: LivevolX

Next, look for a day where the volume is well above the average daily volume, followed by anotherin conjunction with a nice increase in the stock’s price, typically coming off of a tough couple of days, or some days of choppiness in the stock.  Here is RIG on March 1st:

Source LIVEVOLX

Then RIG on March 2nd

SOURCE LIVEVOLX

Then the following morning there will be a HUGE increase in volume that leads toward a volume day amounting to likely near double the stock’s normal average daily volume. In addition the stock will likely be up BIG on the open, but despite the pop is likely to keep going., with the shorts getting squeezed out by margin calls and stock buy-ins.

RIG on March 3rd

Source LIVEVOLX

This is the time to make the point to go long the stock.  However, one might want confirmation of a squeeze. It’s actually easy to confirm. Take a look at the implied volatility of the options. At the first move, the IV may go down as hedger and other market participants adjust risk on a rally. Additionally, IV has a natural inclination to fall when stocks start to rally. However, after an initial drop in IV, the IV will start to rally.  See the structure of RIG below:

LivevolX

Notice IV is ticking up with volume and the stock. This is unusual. One can then see what the IV does the next day. Intuitively, what does one THINK happens to the stock? Below is the full chart for this data set. Notice the price action of RIG:

LivevolX

This is the classic short squeeze. Price action, volume and implied volatility all align to show that there is a major squeeze on. The key is to be patient and not to try to jump in too early but wait until all three factors happen:

  1. Stock rallying;
  2. IV rallying; and
  3. Stock volume up well above ADV two days in a row and exploding on the opening of the thirdday

LivevolX

Once this happens, it is usually time to buy the underlying or set up a long trade using options. Looking at GPRO, it’s time to get out once the volume starts to dissipate in the name (one could look for a short set-up but that is an entirely different chapter).

Setting up the Trade with Options:

One of the beautiful things about a short squeeze is that it will allow the trader to set up a long trade that is somewhat simple. The IV tends to go up and up and up. And the stock tends to rally and rally, with intermittent random drops, but the IV will be stable on drops. The beauty is that if one gets in on the beginning of the third day, often the option market has not fully figured out what is actually going on. There has yet to be a true “rush” for options.  This makes call options look favorable.

However, at Option Pit we typically hedge everything. Thus we will apply a directional delta to a straddle or strangle. In a name like RIG, let’s look at how we might have set up a strangle on March 2nd. Take a look at the option montage from LivevolX

We might look at RIG’s 10.5 straddle with about three weeks to expire. We might pay .87 and .55 for the strangle adding up to 1.32 debit for the straddle. Now, recall this is the end of the day snapshot, not the cheap levels that were available in the morning. This allows for the trade to do well if the stock moves back from whence it came (below $9) or if the stock completely explodes. Now let’s look at how the directional delta works out the following day.

LivevolX

While the S&P was up about four on this day, RIG was up 17%.  There is something going on in the energy sector. 

Now that the straddle has been a home run, the trader would typically dump all of the calls (locking in the huge win), selling them at 2.65. The IV still has room to run, so the trader might then set up a new trade buying 13 calls (this time just out of the money) for about .75 or so. The trader now owns the calls and the existing puts and has a credit in his or her pocket. 

If the trade slows down for even a second, unwind the whole trade. A whole new short squeeze trade may set itself up. It can happen over the ebb and flow of trading multiple times.

THE SPECIAL OFFER

Now you have seen how to set up a standard short squeeze, you might consider signing up for Option Pit Live. We are offering a special trial to Option Pit Live, including our subscription chat room and strategy letter for new and budding professional traders. This subscription is normally $125.00 a month, but you can give it a try for just $17.00. Even better, after your first month, rather than $125, you pay $97 a month for this amazing subscription.

This chat room will give you special access to Option Pit live traders that are considered among the best in the world. Additionally, the subscription comes with some amazing education that only subscribers get for free. Non-subscribers pay big dollars for the same information.

Option Pit Live includes:

  • The Option Pit strategy letter full of daily actionable ideas, adjustments and risk management strategies;
  • Free access to our monthly Saturday classes, when we delve deep into a subject. These classes sell for on our site for $247.00;
  • Daily recorded lessons on management: The Pit Report; 
  • 2+ hours with Option Pit's professional traders;
  • All day access to Option Pit's chat room;
  • Special deals and free goodies from Option Pit;
  • Access to special deals on software and brokerage.

This offer will only be available for a short period of time. In order to make sure the chat room does not become diluted, this offer will be removed once the first 88 members sign up!
Visit this page to join the team for a test drive

ABOUT THE AUTHOR

Mark Sebastian is a former member of both the Chicago Board of Options Exchange and the American Stock Exchange. He is also the author of the popular trading manual "The Option Trader’s Hedge Fund."

He is a frequent guest on CNBC, Fox Business News, Bloomberg and First Business News. Sebastian has been published nationally on Yahoo Finance, quoted in The Wall Street Journal, Reuters, and Bloomberg and is an “all-star contributor” for TheStreet.com’s option profits team. Mark has spoken for The Options Industry Council, the CBOE, the ISE, the CME, and is a co-host on the popular Option Block Podcast and Volatility Views podcast.

Mark has a Bachelor’s in Science from Villanova University.

Chapter
06

Combat Trade Planning

By Matt Buckley, TopGunOptions.com

The most important trading floor for any trader, individual or professional, is the five-inch trading floor between his or her ears.  Having the proper mind-frame and controlling emotions is critical to making good decisions under the pressure of the markets and, ultimately, to trading success. It all comes down to discipline.  We need to know why we are getting in, when to stay in and when to get out of a trade.  At Top Gun Options a quality trade plan is the foundation for our disciplined execution in every trade.

As flying fighters in the US Navy we planned everything, from a simple 30 minute maintenance flight to a 7 hour combat mission.  Every mission had an objective and we always had a plan to achieve our objectives.  These plans spelled out exactly how we intended to achieve each objective.  The team at Top Gun Options learned how to plan and plan well. 

At Top Gun Options, we were trading before we joined the Navy to fly fighters, so we had built up some habits about how we went about our business of trading.  Some were good, some were bad, but these habits lacked discipline and continuity.  Then one day, shooting the breeze at the Officer’s Club (which is where we solved all the world problems over a cocktail) it just kind of hit us; why don’t we apply the same planning and execution disciplines that we use flying fighters in combat to our trading?

After all, our combat plans defined many things, to include: our objective, tactical mindset, targets, Commit Criteria (our go-no-go decision), the Tactic we intend to use to achieve our objective, employment method to achieve the Tactic, our course of action (steps we are going to follow executing the plan), contingency plans in case things don’t go exactly as planned and we must also have a clear Exit Plan.  So this tactical planning we used every day out on the aircraft carrier seemed a perfect fit for the options trading world as well!

You have to plan for combat in this manner, because combat is dynamic, it’s dangerous, the battlefield is in constant change and you don’t know where your enemy will strike from next.  Sound familiar?  Where did this Greek debt crisis come from, how about Enron or WorldCom?  Which bubble is going to burst next?  Who’s cooking the books at our favorite company?  Well, it seems to us, this definition of combat applies directly to the financial markets.

Which is why at Top Gun Options, “Trading is Combat” because it is!

In this lesson we are going to share with you our planning process.   Is it perfect and suited for everyone?   We certainly like it and we believe that you will benefit by applying the same discipline to your trading.

Defining a Plan

So just what is a plan?  You don’t have to be a Rocket Surgeon to understand this one!

A plan is a series of steps to achieve an objective.

This makes sense if you’re going to hang some shelves in the garage or cook a pot roast.  A plan is just a recipe and when it’s complete you have some more shelves in the garage or a pot roast for dinner.

But, how does this definition work when you are playing in one of the most dynamic arenas in the world, where things are constantly changing and often appear to be directly against us?  It still works, but the plan has to suit the environment where it is going to be executed and we are executing plans in one of the most complex environments in the world, the financial markets.  So, we need to account for a few more things than cooking a pot roast.

When I am giving a presentation on planning, I always ask the crowd to write down the components of a plan.  Invariably they are always slightly different and in many cases folks can’t break a plan down into its important components.  This lesson will solve this issue.

Why Plan?

Discipline

A trade plan is the foundation for disciplined execution.  It allows us to keep our head on straight when all the talking heads are telling us the world is falling apart.  It memorializes our reason for being in the trade and helps us make good disciplined business decisions under the pressure of the markets.  It is because we built a plan, before the heat was on, that allows us to remove as much emotion as possible from our trading.  In short, a trade plan is our tool to keep us disciplined in a trade.

Risk Management

Risk management is built into the plan.  We know exactly when to get out, what our maximum acceptable loss is for the trade and how we are going to get out or adjust the position to save profits or limit losses.  We define all of this before we get into a tight spot where emotions can take over and lead us to bad decision making.  Emotions: greed, fear, attachment to a trade, whatever the issue, will influence your decision making.  If you think it doesn’t, you are going to spend a lot of money realizing that you’re wrong.  Laying out your risk parameters before being under the gun, will greatly assist you in suppressing your emotions and help you make good decisions.

In the Top Gun Options Pocket Checklist (OPCL), we layout planning guidelines for several different option tactics.  In each, we identify our profit targets and maximum risk parameters for each trade to assist you in building your plan.

Superior Execution

When we get down to the brass tacks of trading, it’s all about execution.  Being disciplined and mapping out our risk parameters before we are deep in trades leads to Superior Execution. The decisions we make in the heat of battle are key to our success in trading.  We have a saying as flying fighters, “A bad plan executed well is better than a good plan executed poorly, but a good plan with good execution Discipline is unbeatable!”  When you go through our Top Gun Options program, we will go over several options tactics and discuss optimum execution whether the market is trending favorably or unfavorably.

Ultimately Discipline, Risk Management and Superior Execution come down to the individual trader.  As traders, we have to commit to being disciplined.  We have to commit to sound Risk Management.  We have to commit to achieving Superior Execution with our trading.  It takes practice and courage to execute your plan, but the end result is consistent Superior Execution and more profits.

Components of a Plan

A plan has to be tailored to the environment we intend to execute.   The planning process needs to flow sensibly, be easily understood and address as many potential scenarios as possible that can threaten the achievement of our objective.

The very first component in any plan is “The Objective,”  As traders and investors it does not matter if you are trading options, stocks, commodities, bonds, currencies or anything for that matter.  Our objective as traders and investors is universal:

Make Money, Don’t Lose It!

This is why we play in this financial arena; there is no other reason.  We want to make money, not lose it!  Every trade plan we create supports this objective…we want to make money, not lose it!  If we are wrong in our trade, because we are not going to get them all right, we want to get out with minimal damage and keep our money to play another day.

Since this is our universal objective, we don’t need to write it down every time.  It is our guiding precept for trading.

After the objective, a Top Gun Options trade plan has seven components, designed specifically for trading options.  A Top Gun Options trade plan…

…Defines our Strategic Mindset

…Identifies our Target...which is the underlying we want to engage.

…Outlines our Commit Criteria…Our justification for the trade.

…Identifies the Tactic we will use.

…Sets up our Tactical Employment.

…Outlines our Mid-Course Guidance…which is our trade execution plan.

…And finally outlines our Exit Plan

Once the planning process is understood, a trader can complete the plan in as little as 5-10 minutes.  We will go through each one of these components in this lesson.

Some of these terms may be new to you and that’s because they have their roots in air combat, but they dovetail very nicely into our planning and, in our view, tighten our focus up another notch.  We will explain each as we come across them if not,there is a Top Gun Options Terms glossary in the back of the book for reference.

Strategic Mindset

Our Strategic Mindset is the stance we take regarding how we think our underlying asset (our target) or the market will perform given the current financial climate.  Strategic Mindset falls into one of four categories:

1.      Bullish

2.      Bearish

3.      Neutral

4.      Volatile 

We can qualify our mindset if needed; we can be short-term bearish if we think something is overbought and might correct.  Or we can be neutral to bearish or neutral to bullish.  It just depends on our analysis of the current situation and guides our Tactic selection to fit our Strategic Mindset.

When developing our Strategic Mindset we take a big to small approach.  We start with the global financial situation and drill down to specific sectors, then to the stocks within a sector using both fundamental and technical analysis.  As options traders we always take a look at our main barometer, the VIX, to tell us what the market is thinking and how the current market is priced.

Our Strategic Mindset drives many of our trading decisions.  It helps us to analyze potential positions with an appropriate bias for the current market.  It also gives us a baseline to challenge our own market assertions and those assertions of all the information we absorb.  We don’t want to be mindless sheep following the talking heads on CNBC or a tip we hear at work.  We want to be proactive in the development of our Strategic Mindset and verify or disqualify the information we hear around us.

Target

Our target is simply the underlying asset with which we are looking to open a position.  We will focus on an asset because we have clearly defined our Strategic Mindset on this target and we think we can profit from an options position supporting this mindset

There are literally thousands of optional targets: Stocks, ETFs, futures, commodities.  We will focus on stocks while going through Top Gun Options.

Commit Criteria

Commit criteria is our justification for entering in a trade.  Commit criteria should be easily understood and explained in 1 – 3 sentences.  Commit criteria is supported by our Strategic Mindset, our fundamental and technical analysis, and the volatility of the target. 

Here is an example of what Commit Criteria might sound like if we had a bullish mindset on Freeport McMoRan (FCX).

“The recent pullback in FCX is exaggerated.  The stock has come off its recent lows with heavy volume and appears to be at the beginning of bullish trend with a short-term technical price target of 70. Fundamentals remain strong and copper prices are rebounding.”

This is a valid Commit Criteria for entering a  trade.  Commit criteria memorializes why we are in the trade.  During the course of a trade, if we can no longer justify our Commit Criteria then we get out, immediately.

Tactic

At Top Gun Options, a “Tactic” is the option position we are opening, and there are many different positions we can open using options: calls, puts, condors, butterflies, credit spreads, etc.  In the Top Gun Options Pocket Checklist (OPCL) you will find 32 different option tactics.

In current options lingo this is referred to as a strategy, but to call this a strategy is not true to the word’s meaning.  A strategy is a bigger vision that supports our “objective” and refers to a plan of “actions” to achieve our objective; in this case, our investment objective. The “actions” taken to achieve these goals are referred to as “tactics.”

Example:

Objective:       Make Money, Don’t Lose It!

Strategy:         Use options to achieve our objective.

Tactics:           An option position to support our strategy.

For instance:  If a trader wants to earn income from stocks in their portfolio by selling covered calls.  This supports our objective and the strategy is to earn extra income with options.  The Tactic to achieve this extra income is to sell covered calls on stocks in their portfolio.  

To us at Top Gun Options, this is a more correct way to add detail to our intentions.  In short, a strategy tells us what we want and a Tactic is how we get what we want.

Tactical Employment

Tactical Employment is the set up for our option position. It includes:

●     Leg Set Up

●     Net Debit or Credit

●     Max Profit potential

●     Maximum Risk of the trade

●     Break Evens

●     Probabilities of success

●     Adjust and Eject Criteria

●     Greek Effects

Outlining Tactical Employment lets us know what we are getting into when we enter a trade.  Think of Tactical Employment as defining the performance envelope for our trade.  It defines the parameters, both good and bad, where the trade can perform.

Mid-Course Guidance

Mid-Course Guidance encompasses our trade management plan.  The term comes from an air-to-air missile and refers to the control of the missile until just before it reaches its target.   At Top Gun Options, Mid-Course Guidance encompasses our Risk Management parameters in terms of profit goal and max allowable loss, threats to success, contingency plans and Eject Criteria.   

Max profit goals and max allowable loss are independent trader decisions based on individual investment goals and risk tolerance.  At Top Gun Options we are not trying to hit the ball out of the park on every trade; base hits can add up fast.  When setting our max allowable loss, we determine the maximum we are willing to lose to see if this trade will work.  This does not mean we have to wait to reach this point to get out, it is simply defining the most we are willing to let this trade work against us.  This keeps us from saying to ourselves, “I just need a few more days for this to work!” or “I love this trade, it will come around,” and staying in a losing trade.  If we hit our max allowable loss, we get out; lick our wounds and move on to the next trade.

Threats to success are occurrences that can negatively affect our position during the life of the trade.  An example of a threat to our success: We were bullish and then implied volatility increased unexpectedly due to a negative economic report. 

Contingency planning is simply having a basic game plan if our trade is not going per design: do we roll up, roll down or get out? 

Our Eject Criteria are our “no questions asked,” just get out of this trade; examples include:  our max allowable loss limit is reached or our Commit Criteria is no longer valid. 

Embedded in your options PCL tactics section is guidance for setting many of these parameters and can serve as a great starting point for determining your own risk parameters. 

Exit Plan

The Exit Plan is how we are going to get out of a trade.  We never get into a fight unless we know exactly how we intend to exit.  Factors for planning an exit include: a sound reason for exit, layout our closing trade set up, whether we are exiting prior to expiration or taking it all the way to expiration.

It is important to know exactly how you are going to exit a trade before the volatility of the markets gets the better of you.

Planning Complete

That’s the plan!  It’s just a logical sequence of steps that encapsulates and memorializes our research, lays out the playing field for the trade, sets risk tolerance tripwires for action while in the trade and lines out how we will exit.  Don’t trade without one!

Once you have the system down it will take 5 -10 minutes max to complete and will keep you aligned very closely with our universal objective.

Make Money, Don’t Lose It!

  Example Trade Plan


Back in January 2010 we were beginning to think that Google (GOOG) was getting a little lofty in price.  Even though the talking heads could not stop talking about how great GOOG was and it was going to the moon non-stop.  At this point we took a short-term contrarian’s view.   So we took a short term bearish Strategic Mindset on GOOG, 7 days, and decided to target GOOG with a bearish trade.

Our commit criterion was simple:

Commit Criteria:

Thinking GOOG is going to give some back in the short term with some of the uncertainty surrounding the release of various mobile devices and some profit taking. On the technical side,

the 20 day MACD is diverging to the down side and RSI is indicating an overbought condition.

We had some technical indicators and some fundamental uncertainty we thought would lead skittish traders to take some profits off the table.  The Commit Criteria is short, sweet and it made sense. Little did we know at the time but this was a turning point for GOOG and it is off about 20% since this call.

Our Tactic was a Bear Call spread two strikes above where GOOG was trading. One of our intermediate tactics and in this instance it had a high probability of success.

Tactic: Bear Call Spread on GOOG, 610/620

Tactical Employment is petty straight forward and requires just a little math:

Tactical Employment:

            Leg Set up:     Sell JAN 610 Call at 3.90

                                   Buy JAN 620 Call at 2.10

                                   Net Credit: 1.80          

            Max Profit:    1.80, 22% return on risk.

            Max Risk:       8.20

            Breakeven:     611.80

            Probabilities:   72% probability of max profit.

The Greeks:

            Theta (Time Value): Time is our Friend, the longer that GOOG stays below our breakeven of 611.80 the stronger our chance of a profit.            

            Vega (Volatility): For this trade we want volatility to decrease for the duration of the position. An increase in volatility with GOOG can easily threaten our Breakeven (B/E) on the down side.

The last part of our Tactical Employment is an understanding of the Greek effects.  In this case Vega and Theta are what we were concerned with and in a bear call spread.  Theta is our friend because the longer that we stayed below our breakeven, the better our chance of profit.  We also wanted to keep volatility in our scan because an increase in volatility could decrease our chances of success.

Mid-course guidance, which is our trade management plan, is relatively simple:

Mid-Course Guidance:

            Profit Target: Profit Target is 1.80, 22% return on risk. 100% return on premium.

            Threats to Success:

–     Jobs Data is being reported Friday, a positive report could cause a move to the upside.

–     We are going against the longer-term trend of GOOG and buyers could step in if they don’t see any more down side.

            Eject Criteria/Contingency Plan:   

–     Commit Criteria becomes invalid

–      We will set our stop loss 25%...Eject if the premium gets to 2.25

Our threats to success over the trade are researched and listed so we don’t drop them out of our scan.

Our Eject Criteria is set; in this case we had a tight stop for two reasons.  First, the short term on the trade did not give us too much time for it to reverse if it went strongly against us.  Secondly, we were going against the long term trend and did not want to get caught in a minor downdraft.   Our only contingency plan was to get out if the trade went against us; we did not want to roll this trade.

Finally, our Exit Plan was simple:

Exit Plan

●     Profit Target or Eject Criteria Reached.

●     To close position, simultaneously,

•      Buy JAN10 610 Call

•      Sell JAN10 620 Call

This is all there is to putting a plan together.  Once complete it should fit nicely onto one or two pages.  The actual trade plan is depicted below:

Trade Plan

January 7, 2010

Strategic Mindset:    BEARISH, Short term (7 days) on GOOG

Target:                       GOOG currently trading at 593.52

Commit Criteria:

Thinking GOOG is going to give some back in the short term with some of the uncertainty surrounding the release of various mobile devices and some profit taking. On the technical side, the 20 day MACD is diverging to the down side and RSI is indicating an overbought condition.

Tactic: Bear Call Spread on GOOG, 610/620

Tactical Employment:

            Leg Set up:     Sell JAN 610 Call at 3.90

                                   Buy JAN 620 Call at 2.10

                                   Net Credit: 1.80        

            Max Profit:    1.80, 22% return on risk.

            Max Risk:       8.20

            Breakeven:     611.80

            Probabilities:   72% probability of max profit.

The Greeks:

            Theta (Time Value): Time is our Friend, the longer that GOOG stays below our breakeven of 611.80 the stronger our chance of a profit.   

            Vega (Volatility): For this trade we want volatility to decrease for the duration of the position. An increase in volatility with GOOG can easily threaten our B/E on the down side.

Mid-Course Guidance:

            Profit Target: Profit Target is 1.80, 22% return on risk. 100% return on premium.

            Threats to Success:

–     Jobs Data is being reported Friday; a positive report could cause a move to the upside.

–     We are going against the longer-term trend of GOOG and buyers could step in if they don’t see any more down side.

            Eject Criteria/Contingency Plan:   

–     Commit Criteria becomes invalid

–     We will set our stop loss 25%...Eject if the premium gets to 2.25

Exit Plan

1.      Profit Target or Eject Criteria Reached.

2.      To close position, simultaneously,

●     Buy JAN10 610 Call

●     Sell JAN10 620 Call

CONCLUSION

The time invested in putting a plan together is well worth the effort.

This trade ended up working out for us and we bought it back for 10 cents and made 1.70 on the trade.  We got out prior to reaching our profit target because we had made a nice profit in the short time the trade was open and market volatility, the VIX, was starting to show signs of life heading into earnings season back in January.

Wrap Up

Having a plan will substantially increase your trading Discipline; it lays out your Risk Management plan and will lead to consistent Superior Execution.  You can complete your plan before or after pulling the trigger.  If we complete the plan after executing the trade, it is because we are familiar with the target and are comfortable trading it.  After we pull the trigger though, we sit back and fill out the plan immediately.

Our planning process represents the minimum knowledge we want to have before we open a trade and it is the tool that gives us the confidence we need to execute our trades with Discipline, manage our risk based on our comfort with the current market climate and consistently manage our trades with Superior Execution.  You may want a bit more or a bit less in your plan, but our system provides a solid foundation for customizing your own trade plans to suit your trading needs. 

Your Options Pocket Checklist (OPCL) contains a planning guide that will help you build solid plans every time.  Plus, we will walk you through many trade plans as we go through Top Gun Options.

SPECIAL OFFER

CLICK HERE to become an Options Weapons School member now!

Visit our site www.topgunoptions.com to learn more information.

ABOUT THE AUTHOR

E. Matthew “Whiz” Buckley is the founder and CEO of Top Gun Options LLC and is the Chief Development Officer and a partner at Black Bay Fund Management LP.

Whiz is a highly experienced financial business executive with decades of leadership and execution experience from the front lines to the front office. Whiz was the founder and CEO of PEAK6 Media LLC, a financial media company. The company provided options and futures news, commentary, analysis, entertainment, and up to the minute reporting directly from the floors of the Chicago Board Options Exchange (CBOE) and Board of Trade (CBOT). This exclusive information allowed retail and professional options and futures traders around the world to execute at a higher level.

Whiz has written a book called From Sea Level to C Level: A Fighter Pilot’s Journey from the Front Lines to the Front Office, which combines his experiences in the military and in corporate America.

Whiz is a decorated Naval Aviator who flew the F/A-18 Hornet for the United States Navy. He flew 44 combat sorties over Iraq and graduated from the Navy Fighter Weapons School (“TOPGUN”).