It is well-known to our subscribers and somewhat known to the trading public in general that a spike peak in $VIX is a buy signal for stocks. In fact, it goes farther than that – a volatility spike peak in any entity is a buy signal for that entity.
In this article, we’re going to try to quantify such buy signals. This is being done partially to construct a trading system from them, but also to gain some more understanding as to just how important these signals are.
Tailor Your Own Custom Options Strategy
Identify and create a custom options strategy fit to your personal needs and requirements. This guide will help you go above and beyond in creating an advanced strategy to tackle opportunities in the options market.
Download Your FREE Options Trading Strategies Guide today!
For example, there have been eight such signals in the past year; six were profitably closed; one was closed for a loss; and the eighth is open and highly profitable right now (having bought on April 19th when $SPX closed at 1555). Let’s begin with some examples of volatility spike peak buy signals, and then develop the trading system.
Spikes in $VIX
When the stock market sells off sharply, it is common (although not mandatory) for volatility measures to increase rapidly. This is generally due to the fact that traders and investors panic and begin to buy (out-of-the-money) puts as protection. They do this during the market decline, and they tend to overpay for the puts as protection, thus increasing the implied volatility of the options more and more rapidly as the market falls. I always liken this to waiting until your house is on fire to decide to buy fire insurance. It’s pretty expensive at that point. Likewise, put protection is expensive when the market is already locked in a rapid decline.
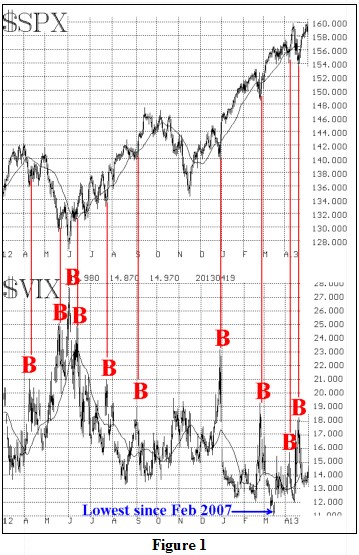
Eventually, though, the panic subsides, and volatility drops sharply. That forms a spike peak on the volatility chart, and is a buy signal for the underlying. Figure 1 on the right shows several such spikes in the CBOE’s volatility index ($VIX), where the “stock market” – as measured by the S&P 500 Index ($SPX) – would be considered to be the underlying. You can easily see that most of the volatility spikes, marked with “B” for “buy,” occur at or near short-term bottoms on the $SPX chart to the right.
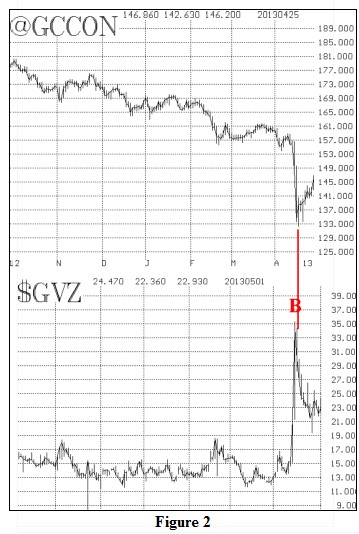
While we generally concentrate on $VIX and its buy signals for $SPX, the concept is useful in other markets as well. Consider Figure 2. It shows the “Gold VIX” (symbol: $GVZ, which is computed by applying the standard VIX formula to GLD – the Gold ETF – options). The “Gold VIX” is plotted underneath a chart of continuous Gold futures. One can see that the sharp decline in the price of gold about 3 weeks ago, caused a panic in the option market, with volatility ($GVZ) exploding to the upside. The peak in volatility occurred the day after the actual bottom in Gold futures (and in other Gold measures, such as GLD). A quick oversold rally ensued.
Often these spike peak buy signals are intermediate-term in nature, but sometimes they are merely evidence of an extremely oversold condition. As we explore the mechanics of these volatility spike peak buy signals, we’ll examine both short- and longer-term holding periods.
A $VIX Spike Peak Trading System
We will attempt to define exactly what constitutes a spike peak in $VIX, and how much of a reversal downward is necessary to generate the buy signal. Furthermore, we’ll address what to do when the signals don’t work out.
After years of observing $VIX, I have noticed that – whether $VIX is high-priced or low-priced – a sudden downward reversal of at least 3 points off of a peak is enough to constitute a buy signal.
I’m sure there are critics who will say that one needs to use a percentage distance for the reversal. But in doing so, a lot of signals can be missed. For example, suppose you said a 20% reversal is needed. Then you’d hardly get any signals when $VIX is above 40, for even at those levels, it doesn’t reverse downward by 8 points very often. Conversely, if you said only a 10% reversal is needed, then you’d have too many false signals at low levels for $VIX. And if you try to scale the percentage reversal required, you’d be moving towards my idea of just using a fixed constant at all times.
While I’m sure we could test many theoretical price moves to come up with the optimum one, I am definitely an opponent of optimization – especially if it differs from my own observations. Optimization produces wonderful back-tested results, but may not be so good going forward.
With that in mind, here is my “system” for trading $VIX spike peak buy signals. I should say that I created this from my past observations and, since it tested well, I did not feel it was necessary to test further scenarios. However, if anyone wants to, that would be fine with me.
- identify a sharply rising or “spiking” $VIX. For my purposes $VIX is “spiking” if it has increased 3 points over the last day, or over the last two days, or over the last three days, close to close. Thus, if $VIX closed at 13 today, then if it closes above 16 on any of the following three days, it would be in “spiking” mode.
- once $VIX is “spiking,” we look for a spike peak. In this mode, we keep track of the highest intraday price that has been reached. A spike peak occurs if $VIX closes any day at least three (3) points lower than the highest intraday price of the recent “spiking” sequence. $SPX is bought at that close.
- the system is stopped out if $VIX subsequently closes above the afore-mentioned highest intraday price.
We monitored the signals for 22 trading days, noting the gains or losses after 1 trading day, 3 days, 5 days, 10 days, and 22 days (approximately one trading month). If the signal is not stopped out, no new signal can arise even if it otherwise would have by the above rules. Once the 22 days had passed or the system was stopped out, only then was a new “spiking” status watched for.
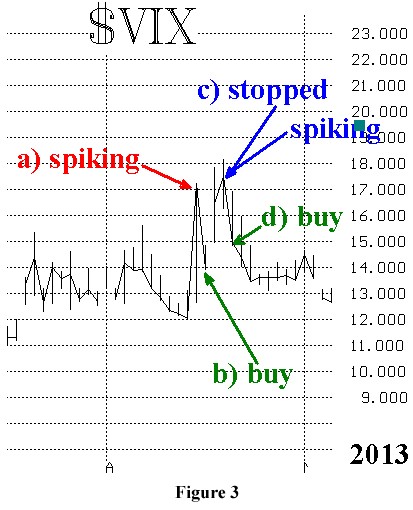
As an example of a “stop out,” consider Figure 3, which shows a recently stopped out signal. At a) $VIX was spiking, having quickly risen from 12 to 17 in two days. A buy signal occurred at point b), when $VIX closed slightly more than 3 points below the “spiking” intraday high. But at point c) $VIX closed above the previous spiking high from point a). That was a “stop out,” and it automatically returned the system to seek for a “spiking” $VIX. It turns out that the close pointed to by c) was a “spiking” bar as well, because $VIX closed at 17.40 that day, more than three points higher than the close two days before, at point b). Hence, the system was immediately looking for another buy signal.
That buy signal was found the next day, at point d) as $VIX closed more than three points below the high of c). This, in fact, is the most recent buy signal and it is still open, having gotten long $SPX at the close of trading on April 18th (at $SPX 1555).
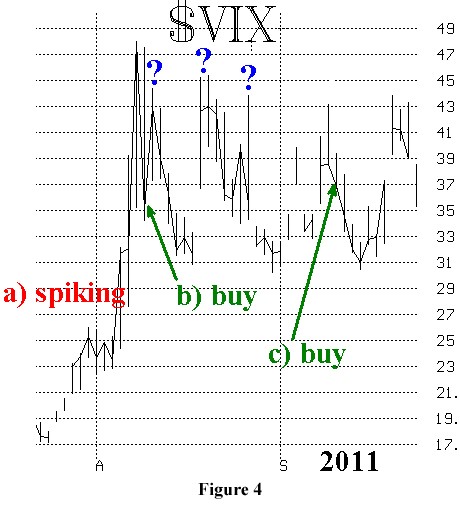
I would also like to clarify a statement I made earlier that, once a buy signal is in effect, no other buys are looked for, even though they might have occurred by the general rules. Figure 4 shows data from August-September of 2011. $VIX spiked at point a) and continued to blast higher, rising from 17 to 48, before finally closing more than 3 points below that at point b), That buy signal remained in effect for the entire 22 days since $VIX never rose above the intraday high at 48. Hence spike peaks obvious to the naked eye – marked with blue question marks – were not included as buy signals in the study since the system was already long. Eventually another buy occurred at point c), which came 23 trading days after the previous signal.
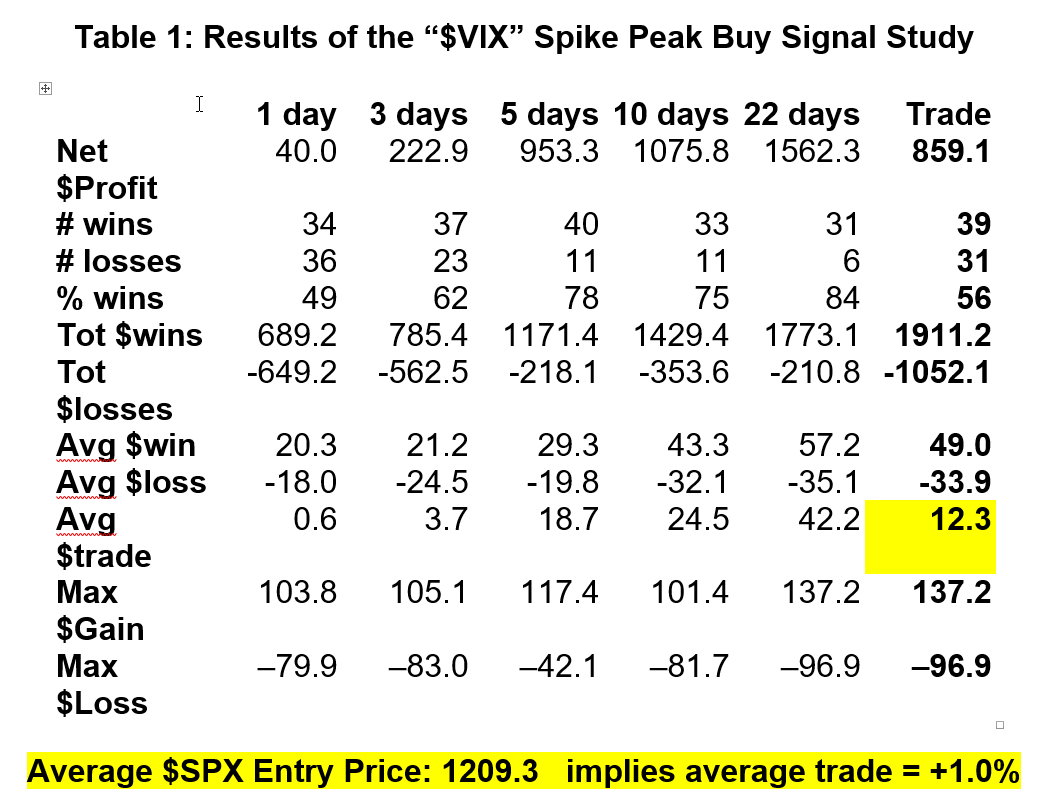
The results of the study are shown in Table 1, above. All profit results – rows with a “$” in the leftmost column – show points of $SPX profit or less, not U.S. Dollars. So, the yellow, highlighted figure in the rightmost column shows that the average trade made 12.3 $SPX points.
The column one should focus on is the rightmost one, labeled “Trade.” This includes the actual result of each trade, including all stops – at whatever point they may have occurred. Conversely, the other columns only have results if the open trade lasted that long. For example, there were 70 trades in total (39 wins and 31 losses). But there were only 37 trades that made it through the entire 22 days without being stopped out (31 wins and 6 losses). Note these numbers in the above table in rows 2 and 3 of the last two columns.
The worst loss was 96.9 $SPX points. That occurred in January of 2009. There was a buy signal given, but the stock market turned and headed lower (eventually bottoming in March, 2009, for good). $VIX never rose much during that decline and hence the system was never stopped out by a higher spike in $VIX.
The biggest gain was 137.2 points coming out of the October 2011 bottom. Note that the maximum gain and loss for one day are both surprisingly large. There was a 103.8 gain in $SPX in one day in October 2008. The worst one-day loss occurred in August, 2011. $SPX lost 79.9 points on the Monday after Moody’s downgraded U.S debt, and the system was long going into that day.
I think this proves what we have known all along – that $VIX spike peak buy signals are excellent entry points for buyers. Many of these occurred in times of high panic, of course, and it may not have been easy to actually buy the market at that time, but it should have been done, nevertheless.
Using Options
These results do not show how one would have done with options, instead of merely buying “$SPX.” Clearly, an option trade could be profitable if $SPX rises 12 points in a month, although we are talking about $SPX options here – not SPY options. So, when $VIX is high, the time value premium of an at-the-money, one month $SPX option could be more than 12 points.
In Table 1, the average win was 49 $SPX points, and the average loss was 33.9 $SPX points. So, if one had bought an at-the-money call on each buy signal, that call would not normally have cost 49 points. For example, at the current time, an $SPX June (7th) 1625 call costs about 19. But during times of very high implied volatility, the call could cost more than 49.
In addition, with options, the large losses would have been avoided. The large losses noted earlier were 96.9 $SPX points in early 2009 and 79.9 points in August 2011. Clearly being long a call option would have had limited losses during those large declines.
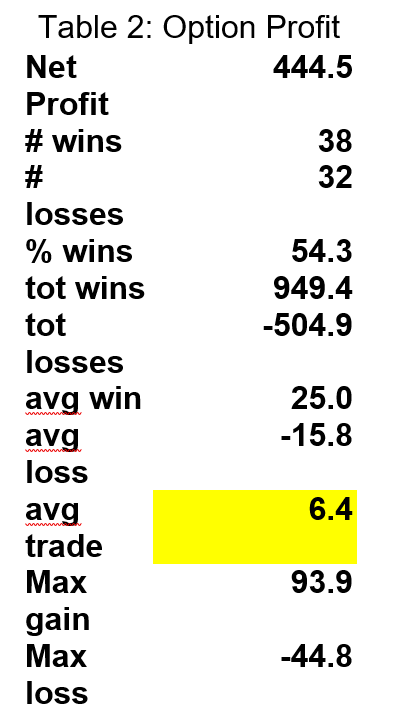
Table 2, above shows the statistics for buying a one-month, at-the-money $SPX call (at the prevailing volatility) and selling at the same times as noted above (including stops). Table 2 is comparable to the rightmost column in Table 1.
The rate of return is much higher with the options. The average profit was 6.4 points (just a little more than half of the average profit of 12.3 points in Table 1), but the investment was much smaller, as the average option upon entry cost 37.6 points. Hence the average ROI was 16.9% on the option trade, as opposed to about 1% for the $SPX trade.
The maximum gain did not occur in October 2011 as it did in Table 1. Rather, it occurred in July-August 2009, when options were cheaper to buy. The $SPX call was bought for 31 and sold for about 125 – a gain of almost 94 points at that time. The max loss of –44.8 points came in January 2009, as it did in Table 1.
Hence, the option approach is better, and now that we have a formal system, we will use it more specifically in the future, rather than just saying “$VIX gave a buy.” Similar returns should be achievable with SPY calls, although commission costs might be larger.
THE SPECIAL OFFER
Get a free 30-day trial to my flagship advisory service, The Option Strategist Newsletter.
Scroll to the bottom, click the “ADD TO CART” button ($28.75) and enter the Coupon Code TPFREE at checkout. No credit card is required. Subscription will not automatically renew upon completion.
Get The Option Strategist Newsletter Here!
ABOUT THE AUTHOR