Jim Cramer calls me his ‘VIX GUY’ because when he has VIX questions I have the answers. It’s not that I am super smart or some sort of mathematician, it’s because I had the opportunity to trade at the firm that rolled out the product.
Being in close proximity to the brains behind the index helped me learn the ins and outs of the product, just like if I was a ball boy for a baseball team, or a student manager for a basketball team. This is why I can confidently say that understand the VIX is not that hard, and using it might be even easier than understanding it.
So what is the VIX? Tthe VIX is the Cboe Global Markets Volatility index. It measures the buying and selling of options on S&P 500 options at the CBOE. Options, while often thought about as ‘leveraged products’ or ‘speculative’ are, for big institutions, an insurance product.
Call options are generally used by big institutions to replace stock, thus putting fewer dollars at risk on an opinion. When not used for that they are used to hedge short stock positions. Most retail traders would be surprised to learn that RARELY are options actually used as a straight speculation on an event or outcome. Retail traders LOVE call options to play a potential rally, big players simply to not think that way very often. Their outlook tends to be months and years, not days and weeks. Other than speculation, one can clearly see the insurance value of a call. Here is the typical scenario.
Trader is long 100,000 MSFT, currently 131.40 near an all-time high. Trader is worried about the stock dropping. Trader buys 1,000 Jan 2020 135 calls (the right to buy 100,000 shares) for 7.70. Trader sells 100,000 shares of Microsoft. Net the trader ends up with similar exposure to MSFT but his or downside exposure is only 770,000 dollars. While that is a lot of money, 100,000 shares of MSFT are worth just over 13 million dollars. The downside exposure is about 5% relative to owning the stock.
Puts, are almost exclusively used by big money to hedge longs. Typically a bank or fund has a large stock position and buys puts to lock in their selling price. Alternatively they will sell puts to market makers to try and buy a stock at a price they like. Rarely does institutional money take straight bet on the market dropping. Again here is a basic scenario:
Company is long 100,000 shares of MSFT, rather than sell and buy calls, the company instead buys 1000 of the MSFT Jan 2020 125 puts for 6.25. Buy owning the puts, the trader’s downside is limited to 118.75, while the upside is unlimited.
Is this simple 4 letter code the secret great trades in 72 hours?
This string of code could be very productive in just 72 hours. Really. This code has spit out 321 winning trades out of 324 tries in the past three years. That’s a 99.1% success rate.
Click here right now to see the INSANE details.
So what is my point in all of this: the VIX is not the FEAR GAUGE; it is the insurance gauge. And smart money buys insurance when it gets scared. I am going to show you, just like I tell Cramer how to spot when the market might drop and when the market is at its bottoms. The key to the enter system is the VIX.
With what I told you above in mind, let’s think about how VIX should act. Generally speaking when the market is up, the VIX should be falling because big investors feel confident about the market. When the market is down the VIX should be rallying because big money is buying protection. ‘Big money’ is just like retail traders; they see what is in front of them and hedge or skip hedging. The big difference between retail and institutional money is that institutional money tends to be out front of tops and bottoms. Smart money starts to hedge BEFORE things turn either way.
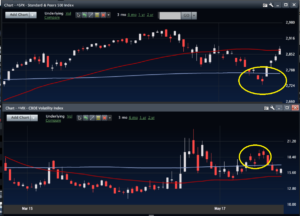
Let’s take a look at a chart of the VIX and the SPX side by side.
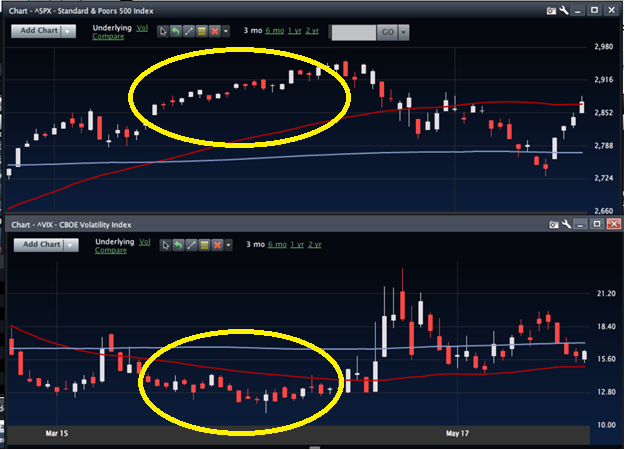

Notice that when the SPX is down VIX tends to be up and when the SPX is up the VIX is down. In the above chart I circled the SPX rally of April 2019 and matching VIX decline. Now let’s look closer notice the VIX at the END of the SPX rally. What is going on?
At the end of the rally in SPX the VIX starts to creep higher. This is a sign that the smart money is starting to buy put options on the SPX. Why would smart money do that? The answer is that the smart money is starting to see a top and is beginning to position themselves for a nice drop in the SPX. Are they right? Take a look at what happened next:

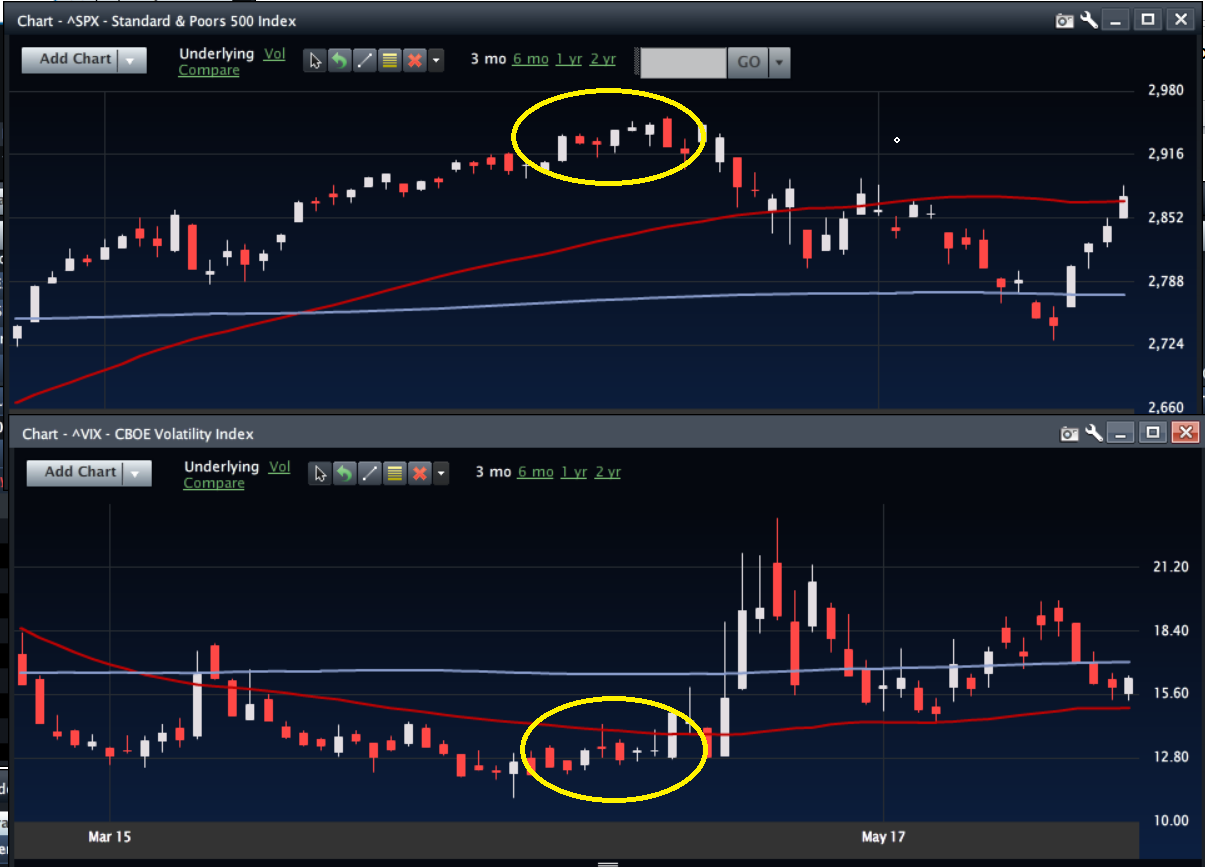
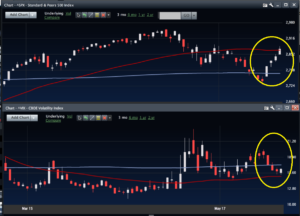
As you can see the VIX popped and the SPX tanked falling from near all-time highs to below 2850 in a matter of days. But it doesn’t end there. The market has a small dead cat bound before it fell all the way below 2800. But then something funny happened, the VIX stopped exploding. Looking closer look at what happened at the absolute near term bottom in the SPX:

As the SPX was bottoming the VIX was failing to rally. On a drop of about 60 points over 2 days the VIX produced 2 red candles and failed to get anywhere near a recent high. The VIX at the bottom essentially did nothing, shrugging off the heavy selling. Why? The answer is that smart money was selling the puts they bought in April BACK TO THE MARKET!!
When the smart money is selling puts to the market place on sell offs, that is a clear sign that they believe the selling is over. Lo and behold, what followed this SPX and VIX price action. We went STRAIGHT UP:

The smart money was telling the world the selloff was over and they were getting ready to go long. Shockingly (not really) smart money was right and the market rallied HARD. Over 100 points in 3 days.
So what does this mean to you? This means you need to learn how the VIX and SPX relate to each other and start noticing the signs of a rally ending or a sell off waning. The system of seeing the VIX and the SPX break their usual relationship has held for years. I successfully called bottoms in the SPX in 2011, 2015, 2016, 2018 and 2019. I did the same on rallies. If you don’t believe me, here is a video of my research provided to Cramer in October of 2018, used on Mad Money, saying the pain is not over for SPX on a day it rallied 60 points….entirely using the VIX and SPX relationship.
So how can you learn to do this? It’s actually pretty simple, add the VIX to your watch list. Watch how it moves with the SPX. When the market is selling off make note of when the VIX is not exploding higher. Moreover, make not when it is flat or barely up on the down days during a sell off. When you see this make note. Count how many days it takes for the market to get its wings. Generally speaking it will be fewer than 3 days.
Alternatively when the market is off to the races keep watching that VIX. When the market is up and the VIX is up more than 2 days in a row count how many days it takes the market to have some selling. Again it will be fewer than 2 or 3 days. As you become more and more familiar with the price action of VIX and SPX you will begin to feel comfortable taking small shots and pivots in the market.
With time as you become more and more familiar with these pivots, these are the times to lighten the load on holdings at tops and/or set up hedges. At bottoms these are the times to employ cash. Is it fooling proof, no? But it tends to works. When this system fails it tends to be related to ‘news bombs.’ Talks fail, or a deal is reached on the macro level that surprises everyone. There is not a lot of ways of spotting these. But in a normal market this system of looking at how the VIX and SPX correlate works close to 100% of the time.
THE SPECIAL OFFER
Want to learn more about the VIX, want to know more about how to use this system? Take our VIX primer class for just 97 bucks. In addition I’ll give you a free month of access to my private chat where you will get to hear me analyze the market on a daily bases. This package is worth 500.00, but yours for a paltry 97.00. If you hate it , I’ll give you your money back.