Most trading methods do make money when trading in perfect trending conditions, but then give back those same profits during periods of consolidation. So if you could learn to avoid consolidating markets, you could profitably trade many sound trading methodologies.
This Special Report from Top Dog Trading is designed to help you avoid choppy markets.
Although most traders spend years seeking new price patterns and indicators to help them know when to get into the market, professional traders spend most of their time working on filters to keep them out of the market!
I’m sure you don’t need me to convince you of that fact and give you a lot of background, statistics and paper-filler, so let’s jump right into the practical stuff.
There are 5 things I’m always watching that help me determine the “condition” of the market. Some apply only to day trading and others apply to swing trading and investing as well.
CONSOLIDATION SIGNAL #1: FLAT 50 SIMPLE MOVING AVERAGE
The teacher of my very first Futures course taught me this. He said as simple as it is, it would be the best thing anyone ever taught me.
When the 50 simple moving average if FLAT, that means the market is flat, and that means your position should be flat!
“If it’s flat, be flat, it’s as simple as that!”
Below is a 2 minute chart of the S&P emini. You can see that when the 50 MA (the red line) goes flat, it’s a clear indication that there is no trend in the market. 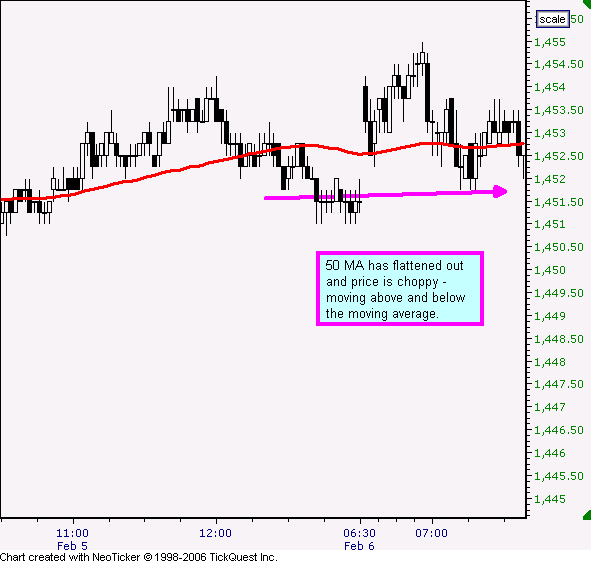
 Invest In the Golden Age of Robotics – Ends 9/29
Affordable, user-friendly robots are no longer sci-fi, thanks to Ally Robotics. They made a robot that costs 70% less to build. It learns by imitating human movement, no coding required. And it already has a letter of intent to work in food service.
Invest in Ally Robotics before their raise ends on 9/29. Invest Now.
The 50 MA will have to be flat for a few bars when the trend is changing. Therefore this rule only applies when it has been flat for an entire cycle (use your favorite oscillator for measuring cycles).
CONSOLIDATION SIGNAL #2: USE TICK CHARTS
Most people use time charts, meaning that each new bar is created after a certain period of time: 2 minutes, 5 minutes, 1 day, etc.
“Tick” charts are charts that create a new bar after a certain number of TRADES are executed. A 100 tick chart starts a new bar whenever 100 trades go through and the 101st trade comes in.
During consolidation, volume tends to drop. Minute charts will continue to form new bars every minute, thus giving you long periods of consolidation on your chart and creating price patterns and indicator patterns you may be tempted to trade.
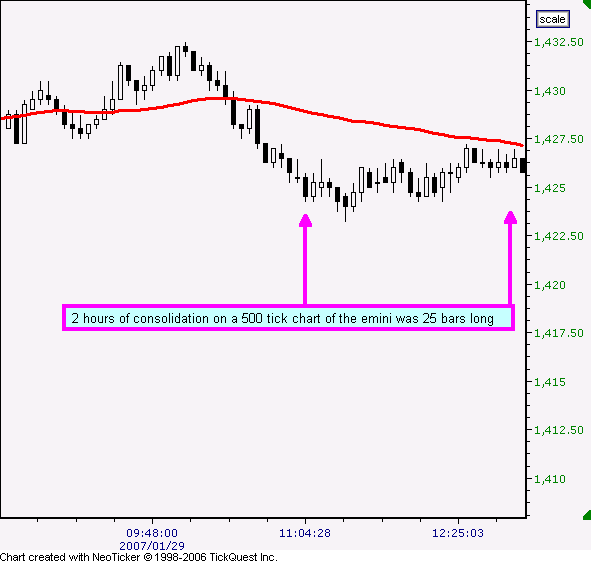
Tick charts, however, print fewer bars during periods of low volume consolidation because they only print new bars when the designated number of trades are executed through the exchange. Therefore you don’t see as much consolidation on your chart, thus removing some false signals and some temptation!
Below is a comparison of the exact same 2 hour period as it looks on a 2 minute chart and a 500 tick chart of the eminis. 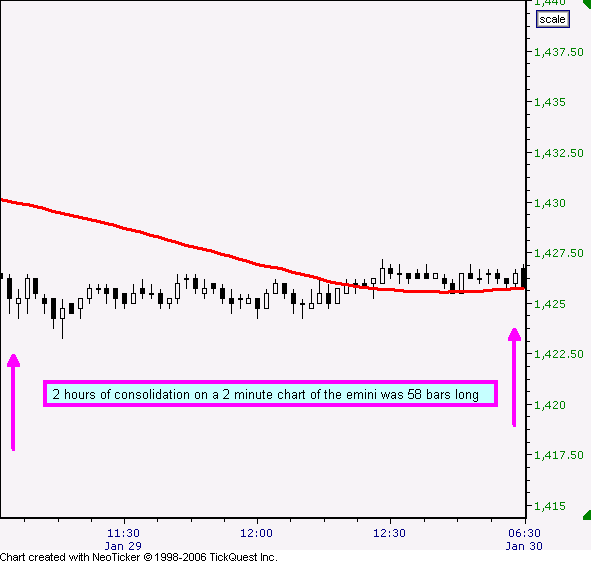
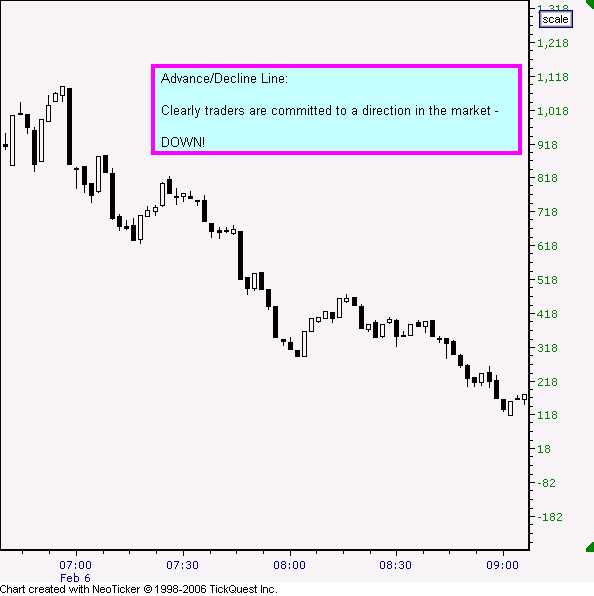
CONSOLIDATION SIGNAL #3: FLAT ADVANCE/DECLINE LINE
One of the indicators you should always be watching, in my never-to-be-humble opinion, is the Advance/Decline line.
This is the difference between the Advancing and Declining issues. There’s one measurement for the NYSE and another for the NASDAQ.
Use whichever one (or both) that relates to the market(s) you trade.
The bottom line on this indicator is simple. Much like the 50 MA, when it goes flat, keep your account flat. It’s an indication that there is no clear direction in the market.
So the market may be trending, but if the Adv/Dec is flat, your “trending” market could change direction or simply go flat at any moment.
For day trading I use a 2 minute chart of the Advance/Decline line.
When I say “flat,” that is a relative term, as it is with the 50 MA. With the 50 MA I’m looking at the angle of the line, but with Adv/Dec I’m plotting price bars and looking for a clear trend of higher highs and higher lows. 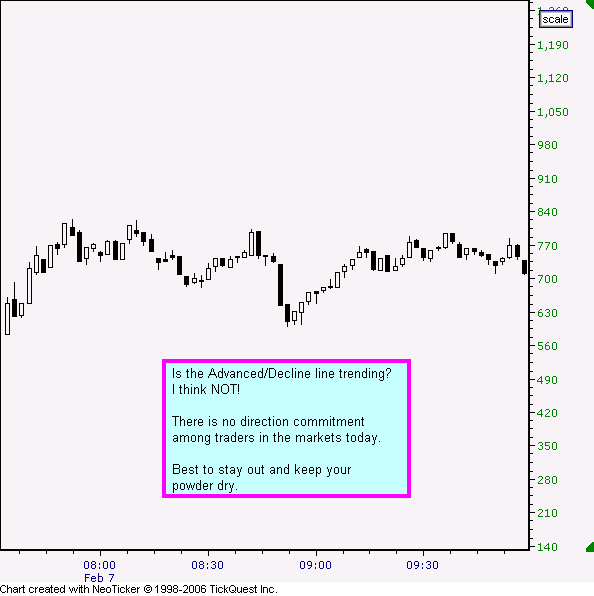

CONSOLIDATION SIGNAL #4: FLAT UP/DOWN VOLUME
Here’s another one of my favorites, and I don’t know many people who use this. Hint: that’s called an “edge” for you and me!
It’s the up/down volume. It measures the difference between the up volume and the down volume, as opposed to the difference between the number of issues up verses down. Again, it’s available for both the NYSE and the NASDAQ.
The key is to watch the relationship of the bars to the zero line (I draw it in as a horizontal line on my chart).
If the bars simply hover around the zero line, that’s an indication that there isn’t any strong commitment of traders in either direction today, and therefore you may have a choppy, trendless market or a trend that is in place is less likely to continue following through.
Sometimes the Advance/Decline line will be trending, but if the Up/Down Volume is not trending, then be careful! There may be more issues going up than down, but there isn’t volume to support the move. 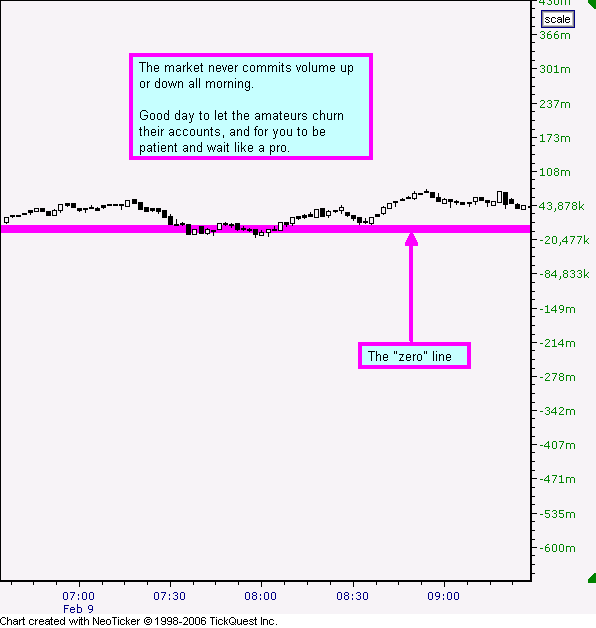
There’s no commitment of volume in either direction this morning. This indicates “choppy weather conditions” on the sea of trading. 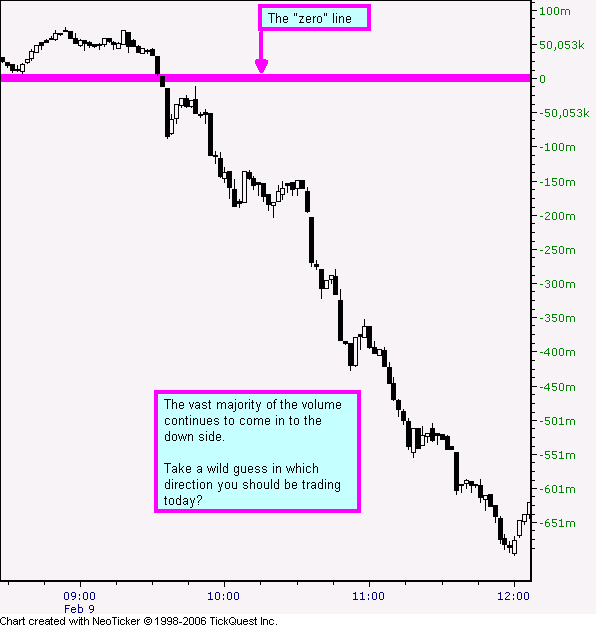
To twist a quote out of context: You don’t have to be a ‘rocket surgeon’ to figure out what the low-risk trading direction is during this volume activity!
CONSOLIDATION SIGNAL #5: INTER-MARKET BIFURCATION
The final sign of a potentially choppy market is when the major indices get out of alignment.
If you’re trading the DOW, or a DOW stock, and it’s trending up nicely, but the NASDAQ is negative for the day, the NASDAQ may have a negative pull on the DOW and hinder its ability to continue trending.
You want to watch to see if the markets are splitting any of the following levels:
- Yesterday’s Close.
- 50 MA
- Central Pivot
“Splitting” any of these 3 levels, means that one of the four markets is above and another is below.
For example, if the S&P is above its close from yesterday, but the NASDAQ is below its close from yesterday, then the overall market condition would be considered “bifurcated.”
Another example: If the DOW is above its Central Pivot, but the S&P is below its Central Pivot, then the overall market condition is considered “bifurcated.”
Although one market will always be stronger than another market, the strongest trending days usually occur when all 4 of these markets are clearly bullish or bearish. When the markets all move together, they move more freely and tend to follow-through more … sometimes trending in one direction for the entire day.
I like to have a quote screen with the following markets at the top:
- S&P
- Russell
- DOW
- NASDAQ
- NDX
- ES
- ER2 (or AB)
- YM
- NQ
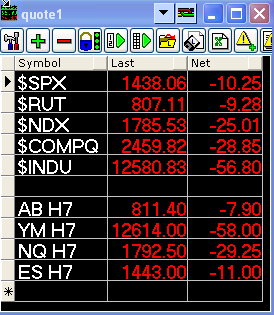
On the quote screen I include a column for “Net Change” from yesterday’s close. This allows me to see in an instant if the markets are aligned with yesterday’s close.
- If they’re all red, then they’re all below yesterday’s close.
- If they’re all green, then they’re all above yesterday’s close.
- If some are red and some are green, then the markets are bifurcated.
In the quote window below, all the markets are aligned to the downside, with all of them below their respective “yesterday’s lows” for both Cash and Futures.