Prices move in patterns! This is due to one basic investment truism. Human nature exhibits the same habits when it comes to managing investment funds which are at risk. Investor sentiment reacts the same way time after time. This is why patterns can be recognized.
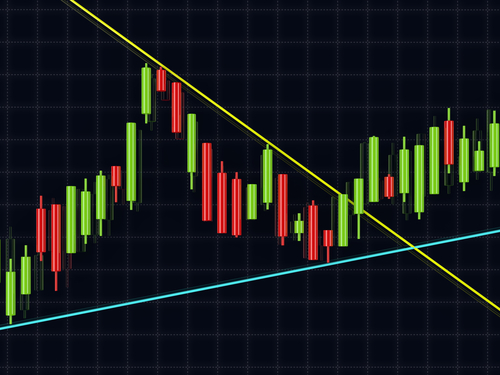
The Wedge formation is a pattern that incorporates very simple facets as far as the conviction between the Bulls and the Bears. The pattern illustrates a diminished oscillation as trading progresses. Visually, the pattern is recognized by witnessing two trend lines converging. The trend lines are formed by connecting the peaks of the trading range on the upside, and the bottoms of the trading range at the lower end of the wedge formation. The direction of the wedge can create a Falling Wedge, a Rising Wedge, or a Horizontal Wedge.
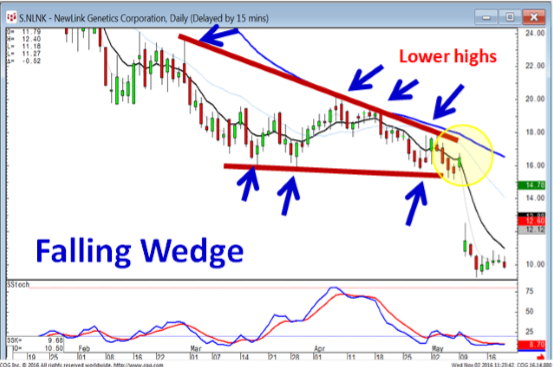
Falling Wedge
Is this simple 4 letter code the secret great trades in 72 hours?
This string of code could be very productive in just 72 hours. Really. This code has spit out 321 winning trades out of 324 tries in the past three years. That’s a 99.1% success rate.
Click here right now to see the INSANE details.
A Falling Wedge has the elements of the highs (peaks) consistently moving lower. The lows can be in a downward direction, but don’t necessarily need to be in a direction. The peaks consistently forming lower and the lows in a downward direction, or trading flat, will still reveal the trend lines compressing to a point.
Rising Wedge
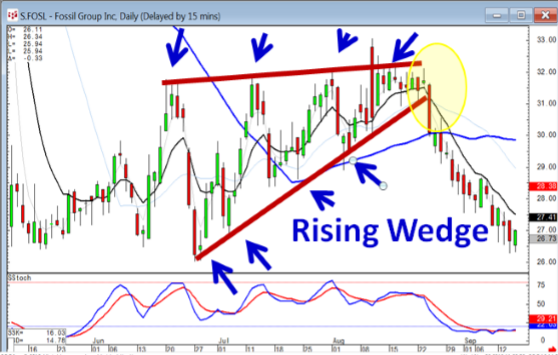
A Rising Wedge is made up of the points of higher consecutive lows with the trading range peaks either moving upwards or remaining flat. In either case, the trend lines are converging. When the trading range compresses, usually to a very small range, more scrutiny should be put into analyzing the candlestick signals at those levels.
Horizontal Wedge
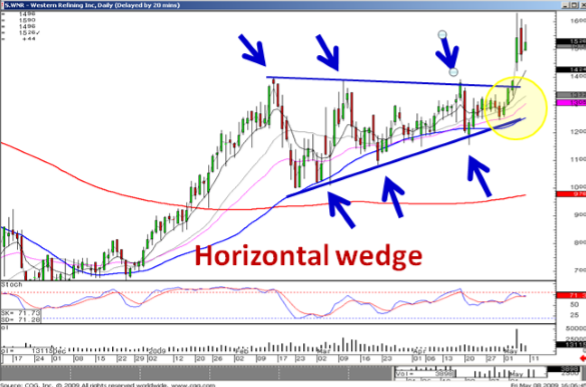
The Horizontal Wedge reveals important information to the investor. It illustrates there is no strong directional bias from either the Bulls or the Bears for any extended period of time.
Obviously, the direction of a Wedge can be very easily identified. A Rising Wedge demonstrates the upward bias of the trading by having both the trending top trend line and the bottom trend line moving in an upward direction. Different from an up-trending trend channel, the Rising Wedge has both trend lines in an upward direction but converging. The same is true for the Falling Wedge. The trend lines are in a downward direction and converging. The Horizontal Wedge indicates the peaks continue to be lower than the previous peak and the bottoms continue to be higher than the previous bottom. This reveals two trend lines moving toward each other. The ultimate Wedge pattern has trading coming into a very small trading range at the intersection of the two trend lines. Realistically, most wedges will break hard one direction or the other prior to getting to the exact point of the wedge.
The Development of a Wedge
Being able to identify when a Wedge is in its initial stages of development allows an investor to make important investment decisions. This identification can only be detected after a couple of trading points have been established.
Wedge Setup
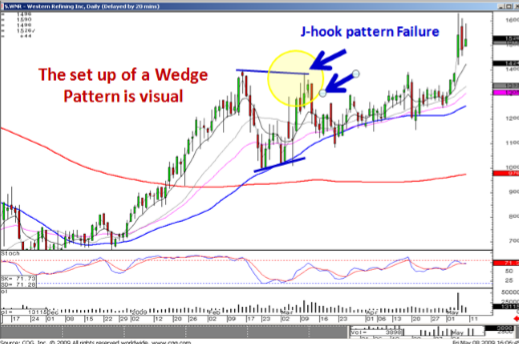
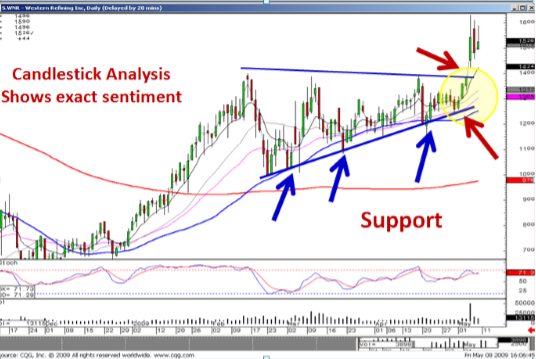
Candlestick analysis provides the visual assessment of what patterns will likely form. As illustrated in the Wedge Setup chart, the strong price move eventually reversed and pulling back down to the 50 day moving average area created the prospects of a J-hook pattern. If buying occurred based on that pattern, with candlestick buy signals forming at the 50 day moving average, the J-hook pattern would have created expectations. When prices got back up near the recent high, there were expectations of what the future price movement should be. A breach of the recent high that would confirm that wave three of a J-hook pattern was in progress.
The failure to reach new highs, illustrated with candlestick sell signals, produced valuable information. First, it demonstrated that a J-hook pattern was not in progress. Secondly, when further selling continued, there was a new pattern expectation. There was now the possibility of a Wedge formation. Why was that important to the candlestick investor? Acknowledging that a Wedge formation may be in progress would have provided information as to the nature of the trend. The Wedge formation “potential” indicated there was no benefit to be involved with this trade currently. There was probably going to be indecisive trading into the future. Move onto something else until another pattern developed or the expected Wedge formation got to a very compressed trading mode. Then it should be readdressed to see if there was going to be a breakout either to the upside or the downside.
As with all patterns, there are expected results. A Falling Wedge usually indicates investor sentiment losing its bearish force and preparation for a big move to the upside. A Rising Wedge usually indicates bullish force is losing strength, preparing the investor for a big move to the downside. The qualifying word in both of those expectations is the word “usually”. Candlestick investors have a major advantage. They can see exactly what investor sentiment is doing at the crucial points of patterns. Although patterns, such as Wedge patterns, have expected results, the candlestick signals will illustrate what is actually happening at a Wedge Breakout area.
There are numerous adages in investing. “Sell in May and go away!” and “The Santa Claus rally!” are just a couple. These adages were developed because of the probabilities that the results are going to be the same as usual. But the candlestick investor has a major advantage. They don’t have to depend on what “usually” is expected. Candlestick signals and patterns allow for identifying what is actually happening. This is true when taking advantage of the results from the wedge pattern. As previously mentioned, a Falling Wedge is the prelude to a big bullish move. A Rising Wedge is usually the prelude to a hard downdraft. The candlestick investor has the advantage of seeing what is actually happening when a wedge formation starts getting into the compression stage. There will usually be a breakout and the candlestick investor can see immediately which way the breakout is going to occur.
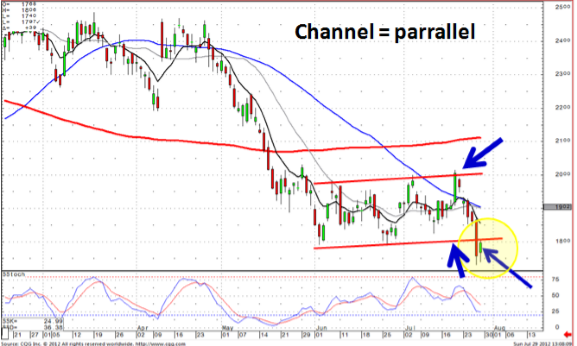
Support and Resistance
One of the underlying factors that identify pattern setups is support and resistance levels. The identification of a support and a resistance level allow investors to be prepared for a change of investor sentiment. Trend channels provide that information. The trading channel is based on an upper resistance level and a lower support level. When trading continues to oscillate from the support and resistance levels, it illustrates there is no major change of investor sentiment. Wedge patterns illustrate the same sentiment. The difference between a trend channel and a wedge pattern is not that significant. The trend channel is two parallel lines with the trading oscillating between the trend lines. The Wedge pattern has the trading between the upper resistance trend line and the lower support level trend line, but the trend lines are converging. Investor sentiment can still be identified as indecisive until a support level or a resistance level is breached.
Trend Channel
Many investors ask, “How can I scan for a Wedge formation?” Because a Wedge formation can have numerous trend characteristics, such as the Rising Wedge, Falling Wedge, or Horizontal Wedge producing directional characteristics, the scanning techniques are very difficult. This is where visual analysis becomes the primary factor.
Scanning for a Wedge formation is not an important criterion. This is based on the nature of a Wedge formation. It’s going to continue moving in an indecisive, nondirectional nature until the trading range becomes very compressed. That process is going to take additional time. The recognition of a Wedge formation has a couple of functions. First, it informs the investor that there is no major direction to be exploited in the near future. Better opportunities are going to be elsewhere.
Recognizing a Wedge formation provides the opportunity to make a big profit sometime in the future. The trading chart should be put onto a watch list. When trading gets much closer to the point of the wedge, compressed, is when more active analysis should take place.
Dollar Chart
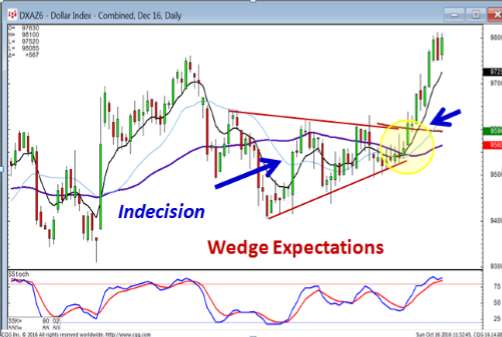
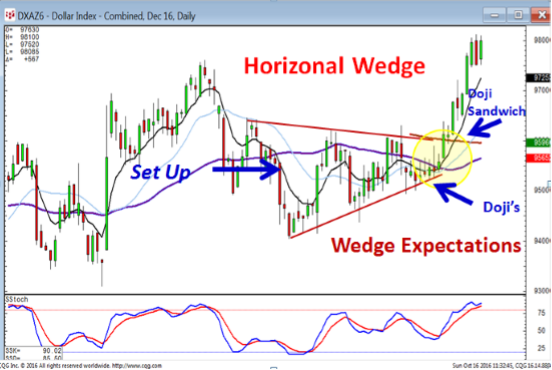
As illustrated in the Dollar chart, there isn’t going to be a decisive direction until a breakout from the Wedge formation. That immediately informs an investor that the risk/reward outcome of trading profitably within the Wedge formation is not going to be worthwhile. Move on to something else until the Wedge formation
gets to a small, compressed trading range. That now becomes the time to start looking for a big price move, either to the upside or downside.
Wedge Pattern Expectations
Patterns are recognized due to the expected results based on historic results. The Fry Pan Bottom pattern, upon breaking out, is expected to produce a very big price move. A Scoop pattern is expected to have a big slingshot effect, a big price move. The reason any pattern is identified is because it produces higher probabilities of a result occurring. The qualifying word in that statement is “probabilities”. Nothing is ever set in stone. However, the candlestick investor has a huge advantage when visually analyzing patterns.
A Rising Wedge formation has high “probabilities” of a strong down-move once trading breaches the lower support level in the compression area. But that is not a 100% occurrence. Fortunately, the candlestick investor can evaluate what is occurring when trading gets to the compression area. The expectation is the downward movement, upon breaching the lower support level. But it also can illustrate the compression of investor sentiment may be ready to push up through the resistance level.
Rising Wedge
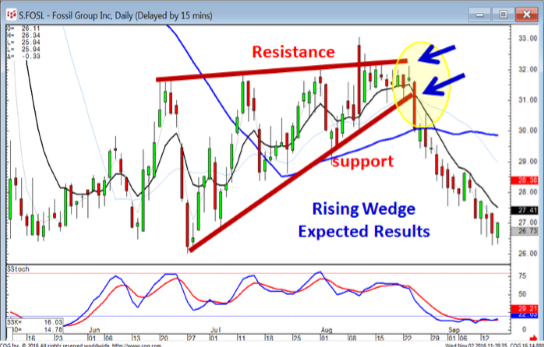
Once an investor understands the implications of a Rising Wedge, with the investor sentiment built into it, it allows an investor to participate more aggressively and with confidence in the next price move. The main criteria for identifying the development of a Wedge formation is to take advantage of the results once the support and/or the resistance levels are breached.
As illustrated in the above chart, the Doji followed by hard selling down through the support level would have indicated immediately which direction the new trend would be. It also allows the investor to assume that, once it has traded below the support level, a strong downtrend should be in progress. It also allows the investor to assume that if the price closes back up above the support level, the breach of the support level has not occurred. This would warrant closing the position and/or be ready to close the position if new selling did not confirm to the downside in the next time frame.
Rising Wedge Upside Breach
The “probabilities” are better exploited utilizing the information built into candlestick signals. Illustrated in the chart above, the compression of the Wedge pattern is occurring. Candlestick buy signals continue to be witnessed at the support level. The fact that these are actual candlestick buy signals should alert the candlestick investor that a compelling demonstration of buying is occurring at the support level. The candlestick signals reveal a more compelling bullish sentiment versus merely seeing bullish candles supporting at the support level.
Knowing that the candlestick signals represent a higher probability of bullish sentiment and they are occurring as the compression of the wedge is getting smaller, the aggressive investor can start building a position. The expectation would be a possible breakout finally up through the resistance level. Weakness at the resistance level would immediately indicate the Wedge formation was still in progress and trades should be closed out.
A higher probability trade entry results when witnessing a breach to the upside of the Wedge formation. This obviously goes against the probabilities of what should occurring in the compression area of a Wedge. But that is the major advantage of being able to assess what is occurring in investor sentiment at those areas. The expectation of an Rising Wedge “should be” a strong downtrend upon breaching the support level. Utilizing the information built into the candlestick signals improves the probabilities for an investor by viewing exactly what investor sentiment was doing at the compression of the wedge. The visual aspects of candlestick charts circumvent trading by always depending on expected price moves.
The expectation of a Wedge Breakout is a strong price move. It doesn’t matter whether it was witnessed moving in the high probability direction or the low probability direction, the candlestick investor can profit from the expected results. The expected result of a breakout is a strong price move.
Horizontal Wedge
The Horizontal Wedge doesn’t have the same expectations as far as the direction of a breakout. That is where candlestick signals become a greater advantage. The Horizontal Wedge reveals important information as to where and when trading funds should be committed.
Horizontal Wedge
The initial information, upon seeing that a wedge formation was in progress, tells the investor that there is not going to be any dramatic profit potential for a while, until the wedge gets near a small trading compression area. Does witnessing a wedge setup necessarily mean a Wedge is in progress? If there was an immediate breach of the upper resistance level or the lower support level, that would probably make for a different candlestick pattern. Obviously at that point the Wedge pattern analysis would disappear.
Once the support and resistance level converging trend lines can be established, candlestick signals create a major advantage. The series of Doji’s forming at the up-trending support level provides immediate information. The indecisive trading is using the support level as support. Entering a trade can be done on an aggressive basis one set series of Doji’s show a confirmed bullish trajectory. Likely the next up-move was to the top of the trend channel. The more conservative investor can analyze what was occurring this time at the upper resistance level. A Doji formed at that level. The analysis now becomes very simple. The simple Doji rule states that the price is going to move in the direction of how the stock opens after the Doji. A lower open would have indicated the upper resistance level was still acting as resistance. A positive open, as seen in the chart, would produce strong probabilities of a bullish Doji Sandwich in progress. That would immediately imply the upper resistance level was not acting as resistance, a breakout to the upside was in progress.
The expectation of a Doji Sandwich is that more upside movement will occur. A breakout of a Wedge formation to the upside produces the expectation that a big upside move will occur. The more factors that can be put into the analysis indicating a positive move, the higher the probabilities that trade is working as expected.
Review
Candlestick analysis is the process of visually taking information that has formed on a chart and utilizing it to create profitable trades. Knowing what information is built into individual candlestick signals allows an investor to much more clearly assess what is happening in a price pattern. Price patterns have expected results. Those results can be better evaluated because of the information gleaned from candlestick signals.
The Wedge formation, albeit very difficult to scan or put into a formula, is very easy to visually recognize. That makes it a very valuable investor tool. There is not the requirement of formulas or in-depth technical analysis experience to take advantage of a visual pattern.
The Wedge formation provides a number of elements of information. When witnessing the initial Wedge pattern setup, it informs investor that a sideways mode of trading is likely going to be occurring for the foreseeable future. That allows investor to move funds to other trades that are going to have better profit opportunities.
Wedge Within Other Patterns
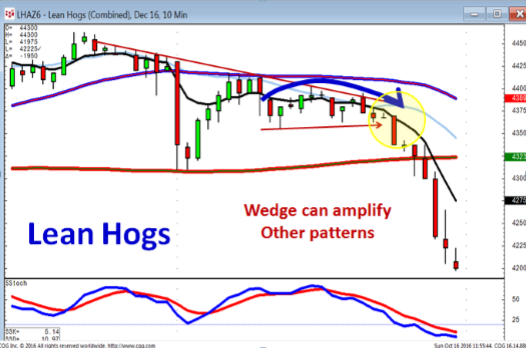
The resulting criteria of a Wedge is the existence of converging trend lines. This indicates the indecisiveness between the Bulls and the Bears is getting more pronounced. Indecision is a highly profitable indicator for the candlestick investor. That indecision can be witnessed in a candlestick signal like a Doji or in a price pattern. The Wedge pattern can also be part of other trend analysis criteria. As shown in the Lean Hog chart, analyzing other candlestick signals and patterns along with the visibility of a Wedge pattern improves the analysis of what will occur based on human nature. Knowing what should occur in investor sentiment as indecision gets well defined becomes a high profit opportunity.
Timing is a very important aspect of profitable investing. As a Wedge formation compresses, candlestick signals can demonstrate when the opportune entry strategies can be applied. Use this information to make high probability/high profit trades.
THE SPECIAL OFFER
You may download Stephen’s Wedge Pattern Breakout eBook to your desktop, PLUS receive his full video training tutorial on How to Trade Wedge Patterns, normally sold for $147 but only $17 through this promotional link.
Get My Video Tutorial Here!
ABOUT THE AUTHOR

Author: Stephen Bigalow
Company: Candlestick Forum
Website: CandestickForum.com
Services Offered: Trading Education, Books, Videos, Webinars, Indicators, Live Trading Room
Markets Covered: Options, Stocks, Forex, Futures
Stephen W. Bigalow has nearly 40+ years of investment experience, including eight years as a stockbroker with major Wall Street firms: Kidder Peabody & Company, Cowen & Company and Oppenheimer & Company.