
By Mark Shawzin, The PatternTrader.com
After spending 23 years trading for 8 different Wall Street firms, there is one simple truth I’ve learned.
There are no true “trading secrets” out there.
Here’s how it works on Wall Street:
For example, in 1987 I worked for Bridgewater & Associates in The World Trade Center, when Black Monday wiped out the Dow Jones.
Most of Wall Street went into a severe panic attack.
Yet one obscure strategy predicted the top of the stock market with crystal ball-like accuracy.
A guy called Paul Tudor Jones executed it like a sniper taking out its target and floated away with $100 million in just 24 hours.
PBS giddily released a documentary about him. Jones was both furious and terrified when the release date came due. He ended up buying every single copy and stopped them from printing any more film, fearing his secrets would be revealed.
Unfortunately for him, Wall Street is worse than The Real Housewives of Beverly Hills (nothing stays secret for long).
From 1992 to 1996 two data scientists from the University of Pittsburgh (Caginalp and Laurent) tested six “secret” entry methods… two of them would have predicted the top of the 1987 Black Monday crash.
They submitted their results to the Applied Mathematical Finance journal. For two painstaking years, data scientists pored over their results.
Finally, their earth-shattering findings were accepted, approved, and published in 1998.
The contents of this study were explosive. They reluctantly proved that it is possible to pull huge chunks of money out of the markets with a simple 3-bar formation that has a tendency to accurately predict when a market is about to reverse. Based on nothing but price.
No indicators, no analysts, no big news events, no underlying earnings reports, no industry growth numbers… just the formation of a few price bars.
In their paper they state,
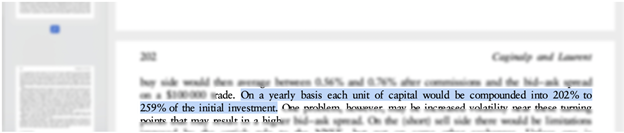
“...a trader who has the same information as others plus the knowledge of this method will have a competitive advantage… On a yearly basis each unit of capital would be compounded into 202% to 259% of the initial investment.”
If you had invested $5,000, you would end up with $15,100 after one year, $45,602 after two years, and $137,718.04 after just 36 short months!
Here’s why these matters to you today in 2021 (over two decades later):
This scientific paper led to an orgy of research into this stupidly simple trading strategy.
Naturally, people were skeptical.
“But what about other markets? And other market conditions?”
The stampede to disprove this strategy started with two other math geniuses (Yung-Ming Shiu and Tsung-Hsun Lu) who tested it in the Taiwan stock market from 1998 to 2007.
They not only agreed with the results of our boys from Pittsburgh University, but they also actually compared a boatload of other strategies. Their conclusion?
“[...]This strategy is more frequent and most trustworthy according to our results.”
One by one, more studies came out. They are STILL testing it every few years. There have been 150 follow up research papers since Caginalp and Laurent published that first one.
Here are more recent examples.
In 2018 the International Journal of Economics and Business Research, published a scientific paper by Chin et al, testing this method in the Malaysian Stock Market.
Later that same year, the Journal of Insurance and Financial Management published a peer reviewed paper that proved it worked in the Vietnamese Stock Market.
Two other researchers from India, Prasad and Murugaiah, tested it in the Indian Stock Market and published their results in an investment journal called Wealth.
There have been four new studies hot-off-the-press in 2021 alone.
That’s true evidence.
This weird and wonderful strategy turned from hot gossip into a bankable scientific fact.
It came in handy once...
After 23 years on Wall Street, I got thrown out, effectively banned from trading for big institutions, and left nearly penniless, with a newborn son on the way.
I was completely on my own.
For nine years the SEC dragged me from one deposition to another for “insider trading.” I spent my life savings defending my name.
The small fortune I made trading on Wall Street wasn’t enough.
They broke me. It was like dying from one-thousand papercuts over the better part of a decade.
I told them outright, “I’ve got nothing left. No lawyers, no money, and no energy to fight on.”
I was willing to go to court with a dreary public defender. I flat-out refused to confess to a blatant lie. But it didn’t come to that.
It turns out… they had no evidence! Zilch. Nada.
Why?
Because I didn’t make any money from the alleged “insider information.”
To get charged with insider trading there had to be some money that was made on that info.
There wasn’t. So, the case was dead.
I signed some form that said, “I neither admit nor deny guilt”. And the whole thing was over. Or so I thought.
The sad consequence of this was that nobody on Wall Street would touch me.
My name had been dragged through the thick mud of the SEC.
I went from a hot commodity in Lower Manhattan to an “undesirable” ...
Like I said… I was on my own. I had to make money, or my new family would starve.
I took the few dollars I had left and became a small-time investor - using the exact same cash generating strategies I used when I was considered a “Shark” on Wall Street.
In fact, the simple method tested by the two data scientists from Pittsburgh became my main money-making tool.
Because…
And in 2021 this strategy has continued its astonishing streak of record profits.
Here’s the best way I’ve found to understand it:
Think of the trade selection process as a “gauntlet” - a harrowing Trial by Fire challenge that only the most profitable trades can survive.
I have broken down this workshop into a series of “checkpoints”.
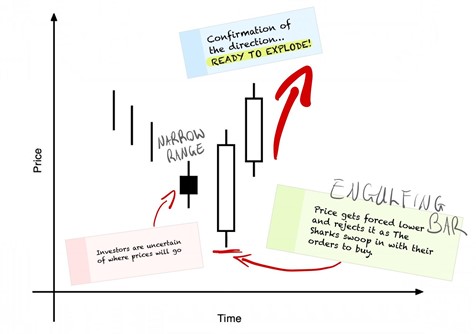
CHECKPOINT #1: Trade the Market With “Explosive Energy”
If you’re going long, you don’t just want a market to hobble upwards, struggling with every breath, to get to the top. You want it to shoot out like a cannonball.
And if you’re going short, you want the floor ripped out from underneath it as it hurtles toward oblivion.
Here’s how it works: Before a Godzilla-like move in price, you need a buildup of “energy”. The more people who are looking at a currency/stock/or metal, and interested in a particular direction, the more pent-up energy the market has.
What it means is this: If you can spot this buildup of energy, you can buy a cheap ticket to board the profit-train before it shoots off like a bullet.
There are exactly 8 chart patterns that have been scientifically tested and accepted into the literature that help you to spot these pockets of energy.
Here is one of the eight:
However, this will only tell you where the market is most likely to go in the next few days…
I want you to execute trades that will continue to produce profits for weeks and sometimes months.
Which is why the next step is…
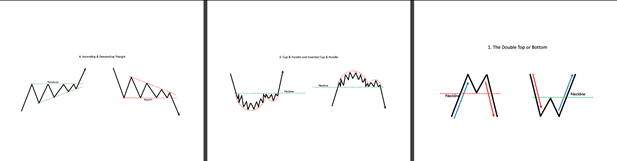
CHECKPOINT #2: Pick the Most Likely Direction For The Next 100 Days
If there is a “secret sauce” to this recipe then this would probably be it.
You’ll be able to get in early, generate some cash in the initial “explosive” move (as described above), and then hitch a ride on a multi-week journey of stunning profits.
There was a collaboration of epic proportions between three universities (University of Nebraska-Lincoln, University of Iowa, & Creighton University).
They looked at four long term chart patterns, decades of market data, and painstakingly waded through one trading scenario after another.
Every time one of these patterns occurred, they would plot the exact path that price took afterwards.
They repeated this process 35,000 times!
...And layered every single one of those scenarios on top of each other.
It turns out that markets follow a predictable path once these patterns occur. A path that you can use to rapidly top up your investment account with found money. It’s kind of like following a map that leads you to a small handful of profitable trades every month.
Here are three of the patterns that were tested. You can only use them as a confirmation of the direction… you cannot enter the trade yet.
This gauntlet is strict. Once those first two checkpoints have been satisfied I need...
CHECKPOINT #3: Let The Market “Confirm” Your Entry
After all the analysis… after the scientific “coil” of energy AND the scientifically tested long term governing pattern you don’t just pile in mindlessly.
Instead, you set up a pending order outside of the chaos. Waiting patiently for the market to knock you into the trade.
There is no need to stare at the charts, agonizing over whether a trade is “correct” or not. No need to second guess yourself or worry that you did something wrong.
The best thing for you to do is to see this strategy in action.
THE SPECIAL OFFER
That’s why I would like to invite you to…
Get Instant Access To The Scientific Trading Formula Course PLUS Join Me Live In The Markets For 4 Days As I Execute This Exact Strategy In Front Of Your Eyes
This is ideal for you if you finally want to experience something that’s truly amazing.
Look, this 4-day event is live. It isn’t a newsletter. It isn’t someone’s “written opinion.”
The easiest way to tell if someone is 100% genuine of what he’s saying is to ask him to put money on it - and to do it in front of a live audience.
Get started here for a refundable $27.
(During the live event I will send proceeds to The American Childhood Cancer Organization).
Don’t forget, as well as the live event you’ll also get instant access to a quick to consume 3-module trading course called The Scientific Trading Formula that’ll allow you to use a rigorously tested method to spot a small handful of trades every month.

Author: Mark Shawzin
Company: The Pattern Trader
Websites: ThePatternTrader.com
Services Offered: Scientifically backed trading education
DISCLAIMER
"This eBook is for information purposes only. Any products or services offered or recommended are not endorsed by OptionPub and neither the company nor its affiliates bear responsibility or control over the content of the information and the product or service offered. There is a very high degree of risk involved in trading. Past performance is not indicative of future results. The profits and performance shown are not typical, we make no future earnings claims, and you may lose money. OptionPub and all individuals affiliated with this site assume no responsibility for your trading and investment results. The indicators, strategies, columns, articles and all other features are strictly for communication purposes only and should not be construed as investment advice. Information for any trading observations are obtained from sources believed to be reliable, but we do not warrant its completeness or accuracy, or warrant any results from the use of the information. Your use of the trading observations is entirely at your own risk and it is your sole responsibility to evaluate the accuracy, completeness and usefulness of the information. Your information may be shared with our educational partners. You must assess the risk of any trade with your licensed investment professional and make your own independent decisions regarding any securities or investments mentioned herein. Affiliates of OptionPub may have a position or effect transactions in the securities or investments described herein (or options thereon) and/or otherwise employ trading strategies that may be consistent or inconsistent with the provided strategies."
By Dr. Barry Burns, TopDogTrading.com
There are many risk management techniques in trading. Some use complicated mathematical models. Others use a combination of art and science.
There’s no one answer to the question of how to manage your risk, other than to use principles that allow you to CONSISTENTLY keep your losses small and try to catch big winners when they occur.
Amateurs are always looking for successful trades. Their expectation is that each trade they place is going to be a big winner. If you ask them this, they of course say “no.” But when you watch their behavior, the answer is clearly “yes.”
How does this manifest itself?
When a trader takes multiple trades over time, but none of their trades turn into large winners, they get tired, get distracted and take a break, skip some trades, and miss the potential big winner.
Beyond simple fatigue, this happens in part because of the trader’s belief that most of their trades should be large winners if the trading method is valid.
Another phenomena that occurs is that after so many small wins, small losses and break even trades, the trader gets enamored with a small or medium size profit, so locks that in before the market has finished its move. Then the market goes into a mega-trend without him/her.
The truth is that most trades taken by successful traders I've seen are small wins and small losses. A good day trader may find that 1-3 of their trades for an entire week account for 80% of their profits for that week. That means 2-4 days with no significant winning trades.
There’s simply no way to know when the market is going to have a major follow-though, so you have to take every setup in your methodology without getting tired. Knowing this before you begin gives you the proper mindset to be consistent, not miss trades, and not be concerned when most trades don’t follow through very much.
It also encourages you to look for those opportunities to hang on to winners when they do occur, because you know that’s where your entire weekly income may be found.
Most traders are aware of the need to trade with a good risk/reward ratio. However the truth is there’s no way to assure that on any one trade. Your risk/reward ratio is established over a history of trading.
You can’t control when or whether the market makes a big move, so you must focus on keeping your risk consistently small.
Again, many traders don’t keep their original risk consistent. This is absolutely crucial, otherwise some losses will be large and others will be small when your protective stop is triggered. This is a recipe for disaster.
When I refer to your protective stops being consistent, there are often 2 misunderstandings that arise:
1. You’re supposed to trade the same number of shares/contracts every time.
2. You’re supposed to trade the same amount of money each time.
Let’s look at #1 first: You’re supposed to trade the same number of shares/contracts every time.
If you trade 100 shares on every stock, then on a $10 stock you’re investing (putting at risk) $1,000, and on a $100 stock you’re putting at risk $10,000. These are not equal risks. Therefore you’re giving one trade much more weight in your portfolio than the other. This is terrible risk management. 75% of your trades could be winners, but if all your winners are with $10 stocks and all your losers are with $100 stocks, you’re still likely to lose money.
Now let’s look at #2: You’re supposed to trade the same amount of money each time.
You may think to solve this problem you’ll simply invest the same amount of money in each stock. So if you decide you’re going to invest $1,000 in each stock, you would buy 100 shares of a $10 stock, but you would buy 10 shares of a $100 stock.
This certainly could be a reasonable approach in that you’re risking the same amount of money on every trade.
But there is one shortcoming to that approach. It assumes that your risk is the ENTIRE position.
It’s true that when you put that money out there, the entire position IS indeed at risk. No question about that. However, what is the probability that your stock will go all the way down to ZERO overnight?
If you’re trading stocks that have decent volume and price (avoiding penny stocks and lightly traded stocks), then that risk is minimal (though we acknowledge that it’s always there).
Here’s the problem:
Your actual risk on 99% of your trades should be only the distance between your entry and your protective stop. But that distance will often vary by as much as 50%. That means your risk on the vast majority of your trades will vary by as much as 50%.
This is the more typical scenario.
Therefore the approach that will level the risk on all your trades is to take the amount you’re willing to risk on a trade and divide that by the distance from your entry to your protective stop.
EXAMPLE:
You’re willing to risk $300 on a trade.
If the distance from your entry to your protective stop is $1, then you could buy 300 shares. If the distance from your entry to your protective stop is 50 cents, then you could buy 600 shares.
It also helps to look at your “budget” and set a maximum amount you will risk if the stock does go to zero. This means keeping the stocks you buy in a certain price range and not risking more than a set percentage of your total trading account (usually 2% or less) in total investment on any given trade. This helps to buffer you from the occasional stock that gaps through your stop or goes out of business. And, of course, solid diversification principles and hedging with options are also critically important.
If you’re not already familiar with these principles, I encourage you to get a book on risk management since the topic is beyond the scope of this article.
Another key aspect of managing risk is what I call “adjusting your cost position” in the trade as soon as possible. In addition to keeping your protective stops, this is a way of keeping all of your losses small.
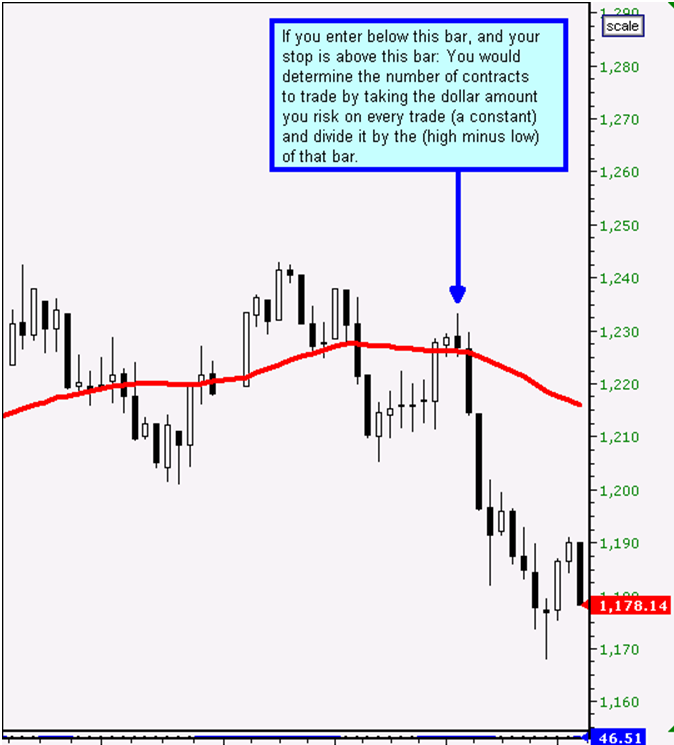
I’ll demonstrate this with an example of day trading the e-mini, but it also applies to stocks, Forex, and commodities, as well as swing trading and investing.
In the example below we’re going SHORT below the low of the setup bar (highlighted) and putting our stop above the setup bar. The exact reason for entering the trade isn’t important, we’re just using this to illustrate money management.
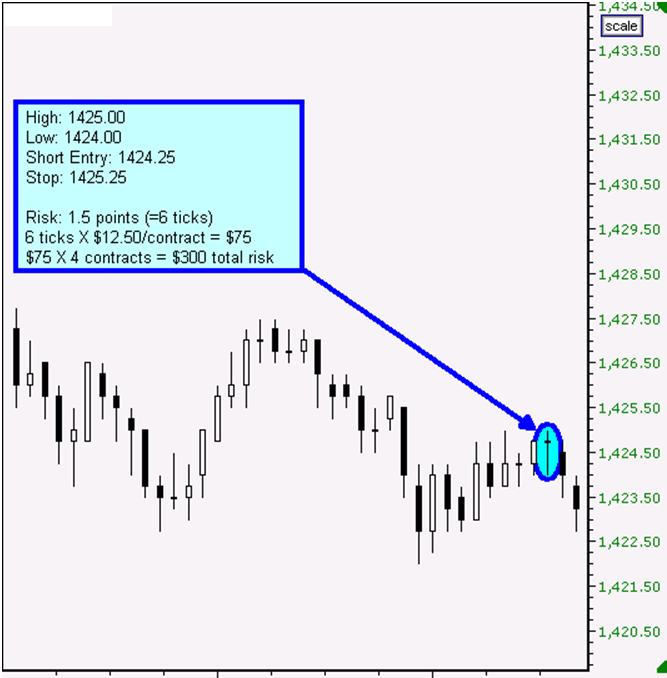
We’re risking 6 ticks and trading 4 contracts, so our total risk in the trade would be $300 if the trade completely fails and we get stopped out.
We could use the last swing low as our first target. That would be 1422.00 and would give us more than a 1:1 risk/reward on the first exit, which would be great … if we reached it.
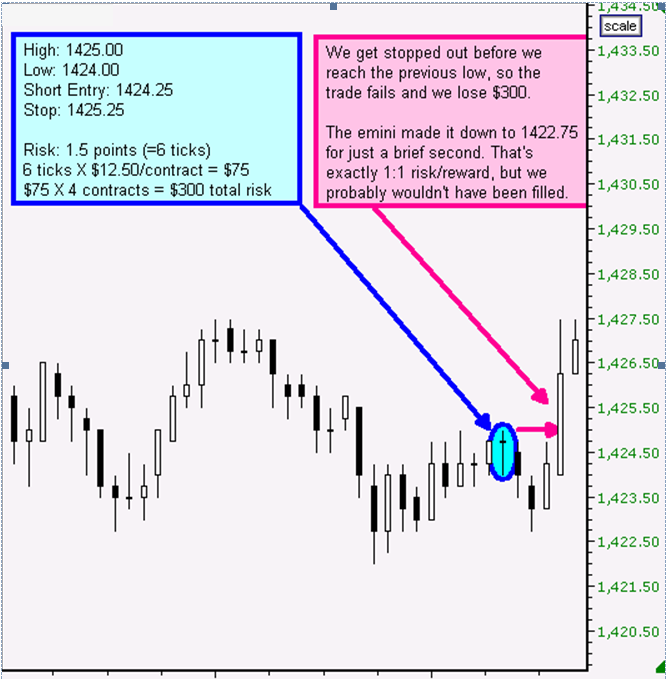
The trade didn’t work, so we lose $300. Don’t you hate when that happens?
If we simply used a strict 1:1 risk/reward for our first exit, that wouldn’t have worked either since price just tickled 1422.75, which was 1.5 points from our entry and exactly a 1:1 risk/reward, but the odds of getting filled were small.
We risked 6 ticks, but instead of insisting on a 1:1 risk/reward, what if we took off ½ of our position earlier, at only a 4 tick gain? Now let’s see how that would change things.
First, the closer you make your first target and the quicker you take profits, the greater your odds that you’ll hit your first target. The risk/reward isn’t as good, but the win/loss on the first exit will be much greater. Getting a 1:1 risk/reward is much harder than most people realize until they try getting it. The odds are generally lower than 50/50!
So if we put our first target at just 4 ticks, then we have a bad risk/reward, but a much better win/loss. Remember, this is only the target for part of our position … say the first 2 contracts.
Now let’s look at the math on the last trade:
The difference in your losses is HUGE!
Here’s the rub:
The FIRST RULE OF TRADING is “keep your losses small.” And this is one way to try to do it.
The primary objection to this approach is:
This reduces your risk/reward ratio because you’re removing fully ½ of your contracts with such a puny profit.
That is absolutely true. If you have a solid trading methodology AND you have the psychological makeup to take many more losses than wins, BUT you also have the psychological makeup to hold on to your winners for the big payoff, then go for it!
But most people can’t handle the large draw down periods of such an approach, so whether it “works” or not isn’t helpful, because most traders can’t “work” it.
However you need to understand the point of this technique. Those first 2 contracts are there for the exclusive purpose of reducing the size of your losses. They are purely defensive. Therefore even taking a 1 or 2 tick profit on them will help reduce your loss.
They are only used to “adjust your cost position” in the trade. They are there to acknowledge that many trades do not succeed, so we simply want to minimize the damage of the losing trades.
They are your defensive players whose job it is to simply hold the other team from scoring too many points against you until your offense can come back on the field and score some points for your team.
And it works for one very good reason: The probability of the market moving 2-4 ticks in your direction are much higher than it moving 4-8 ticks in your direction.
Then you still have 2 contracts left in case the trade actually works! You have a 3rd contract to use for medium profits and a 4th contract to use with a trailing stop to catch the big winners.
This money management trick is a combination of scalping and position trading to help you get the best of both worlds.
Mature and successful traders tend to be impatient with their trades at the beginning because they know from experience that many of them are not going to work out. So they tend to emphasize defense more than offense. Amateurs, on the other hand, tend to be overly optimistic about trading in general, and so tend to emphasize offense more than defense.
THE SPECIAL OFFER
Get one of my favorite trading strategies, "The Rubber Band Trade" by clicking on the button below.

Author: Dr. Barry Burns
Company: Top Dog Trading
Websites: TopDogTrading.com
Services Offered: Trading Education, Free Videos, Books
Markets Covered: Stocks, Options, Futures
DISCLAIMER
"This eBook is for information purposes only. Any products or services offered or recommended are not endorsed by OptionPub and neither the company nor its affiliates bear responsibility or control over the content of the information and the product or service offered. There is a very high degree of risk involved in trading. Past performance is not indicative of future results. The profits and performance shown are not typical, we make no future earnings claims, and you may lose money. OptionPub and all individuals affiliated with this site assume no responsibility for your trading and investment results. The indicators, strategies, columns, articles and all other features are strictly for communication purposes only and should not be construed as investment advice. Information for any trading observations are obtained from sources believed to be reliable, but we do not warrant its completeness or accuracy, or warrant any results from the use of the information. Your use of the trading observations is entirely at your own risk and it is your sole responsibility to evaluate the accuracy, completeness and usefulness of the information. Your information may be shared with our educational partners. You must assess the risk of any trade with your licensed investment professional and make your own independent decisions regarding any securities or investments mentioned herein. Affiliates of OptionPub may have a position or effect transactions in the securities or investments described herein (or options thereon) and/or otherwise employ trading strategies that may be consistent or inconsistent with the provided strategies."
By lawrence McMillan, McMillanAsset.com

The concept of momentum trading has been a powerful force in the markets over the past few years. The traditional concept is that a momentum trader identifies a stock that has already begun to move strongly and trades with the momentum. That is, if the stock is roaring up, momentum traders jump in and buy the stock – attempting to quickly ride it to even higher prices, and perhaps adding to the momentum with their own buying. Similar things can happen on the downside. Some momentum traders will only try to capture a small profit – perhaps just a fraction of a point for some day traders – while others will try to stay in the “hot” stocks until they lose their momentum completely. Those decisions are personal ones that each trader must make for himself – deciding whether he wants to trade for fractions or assume greater risk and try for greater rewards.
The key to this sort of trading is to be able to identify the momentum stocks with some degree of confidence. The trend following method described below has a good track record of success. Since we tend to hold onto our intermediate-term recommendations, preferring to try to let profits run until we are stopped out, we are going to take the viewpoint of buying and holding these momentum trades until they show some signs of weakness.
A proven way of trading momentum is to get on a trend and stay with it. This system, described in full in the book, Street Smarts, by Linda Raschke and Larry O’Connor, is called the “holy grail” (tongue-in-cheek, of course, since there is no real holy grail). It’s quite simple, really – as many good systems are. Philosophically, the system is this:
1) find a market (stock, index, futures) that is trending
2) wait for it to pull back to support
3) buy it when the trend resumes.
Specifically, one must use the following items of technical analysis to implement the system. This implementation is very similar to Linda’s, but I have introduced a couple of small changes which reflect the way that I personally use this system:
In order to explain this concept, we’ll use a “classic” example.
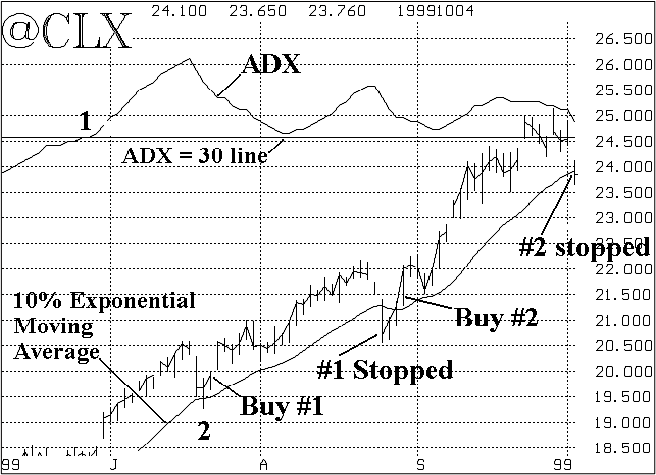
The chart above shows November Crude Oil (symbol: @CLX) when it was trending strongly. First, look near the top of the chart, where ADX is drawn. The straight line indicates an ADX of 30 (there is no scale for ADX on the chart, so this “30 line” is one’s only point of reference). You can see that ADX rose above the 30 line at the point marked “1" on the chart, and stayed there for the rest of the summer. So, by definition, Crude Oil was in a trending mode all summer. By inspection, the trend was up. This satisfies the first criterion: ADX >= 30.
On the rest of the chart, the price chart of @CLX is drawn, along with its 10% exponential moving average. The first point of interest is directly above the point marked as “2". That is where @CLX – which was trending upward at the time because ADX was greater than 30 – fell back and touched the 10% exponential moving average line. This satisfied criterion 2, and a setup was established.
The actual buy (Buy #1) took place the next day when @CLX traded above the high of the day marked as “2". This buy #1 took place at a price of about 19.85. At this time, one would buy the @CLX futures (or options, if you prefer). The initial stop would be set below the low of the day marked as “2" – at 19.20. That particular stop never came into play because prices rose.
Eventually, the buy was stopped out when @CLX closed below its 10% exponential MA about a month later (at the point marked as “#1 Stopped”). The sale came at a price of 20.67 – a profit of 82 cents on this trade.
Interestingly, even though the position was stopped out, ADX was still above 30, so another setup was simultaneously created (ADX was still above 30, and @CLX had pulled back and touched the exponential MA). So, three days later when @CLX traded above the high of the day it was stopped out, Buy #2 occurred – at a price of about 21.40. The stop for this new trade was initially set at 20.50 – just below the low of the bar that touched the moving average. It never came into play, however.
This second buy was even better than the first, with the trend resuming in earnest – carrying prices above the $25 level in Crude before pulling back suddenly and stopping out the position at 23.76 (at the point marked “#2 stopped”) – the last bar on the chart.
This system can be used for stocks and sector indices as well. Potential profits may be quite large if a long trend ensues, and risk is defined within a fairly small amount as designed in the stop criteria outlined above. Momentum trading recommendations are made most frequently in our daily publication, The Daily Strategist, but are sometimes included in The Option Strategist as well.
THE SPECIAL OFFER
Get a free 30-day trial to my flagship advisory service, The Option Strategist Newsletter.
Scroll to the bottom, click the “ADD TO CART” button ($28.75) and enter the Coupon Code TPFREE at checkout. No credit card is required. Subscription will not automatically renew upon completion.

Author: Lawrence McMillan, Founder
Company: McMillan Asset Management
Websites: McMillanAsset.com
Services Offered: Trading Education, Account Management Services
Markets Covered: Stocks, Options
DISCLAIMER
"This eBook is for information purposes only. Any products or services offered or recommended are not endorsed by OptionPub and neither the company nor its affiliates bear responsibility or control over the content of the information and the product or service offered. There is a very high degree of risk involved in trading. Past performance is not indicative of future results. The profits and performance shown are not typical, we make no future earnings claims, and you may lose money. OptionPub and all individuals affiliated with this site assume no responsibility for your trading and investment results. The indicators, strategies, columns, articles and all other features are strictly for communication purposes only and should not be construed as investment advice. Information for any trading observations are obtained from sources believed to be reliable, but we do not warrant its completeness or accuracy, or warrant any results from the use of the information. Your use of the trading observations is entirely at your own risk and it is your sole responsibility to evaluate the accuracy, completeness and usefulness of the information. Your information may be shared with our educational partners. You must assess the risk of any trade with your licensed investment professional and make your own independent decisions regarding any securities or investments mentioned herein. Affiliates of OptionPub may have a position or effect transactions in the securities or investments described herein (or options thereon) and/or otherwise employ trading strategies that may be consistent or inconsistent with the provided strategies."
By Rick Saddler, HitAndRunCandlesticks.com
Have you ever heard "There's no such thing as a free lunch."? That may be true, but I’m here to prove there are some exceptions.
In this short video, I am going to share my favorite chart setup, indicators and Rally-Pullback Strategy that can be used to trade the markets in any timeframe.
I am also going to share how you can get free 30-day access to my Trader Vision 20/20 services. Check out the SPECIAL OFFER below to learn more about this incredible program
SHORT VIDEO PRESENTATION: MY FAVORITE RALLY AND PULLBACK STRATEGY
THE SPECIAL OFFER
To find out more about the The Road to Wealth and other patterns we use in the Hit and Run Candlesticks and Right Way Options Trading Rooms on a daily basis, join us for a 30-day free trial to both rooms. The Hit and Run Candlesticks Trading Room is open Monday through Friday 9:00am to 4:00pm ET and Right Way Options Trading Room is open Monday through Friday 11:00am to 1:00pm ET.

Author: Rick Saddler, Founder
Company: Hit and Run Candlesticks
Websites: HitAndRunCandlesticks.com
Services Offered: Live Trading Room, Trading Education, Software
Markets Covered: Options, Futures, Stocks
DISCLAIMER
"This eBook is for information purposes only. Any products or services offered or recommended are not endorsed by OptionPub and neither the company nor its affiliates bear responsibility or control over the content of the information and the product or service offered. There is a very high degree of risk involved in trading. Past performance is not indicative of future results. The profits and performance shown are not typical, we make no future earnings claims, and you may lose money. OptionPub and all individuals affiliated with this site assume no responsibility for your trading and investment results. The indicators, strategies, columns, articles and all other features are strictly for communication purposes only and should not be construed as investment advice. Information for any trading observations are obtained from sources believed to be reliable, but we do not warrant its completeness or accuracy, or warrant any results from the use of the information. Your use of the trading observations is entirely at your own risk and it is your sole responsibility to evaluate the accuracy, completeness and usefulness of the information. Your information may be shared with our educational partners. You must assess the risk of any trade with your licensed investment professional and make your own independent decisions regarding any securities or investments mentioned herein. Affiliates of OptionPub may have a position or effect transactions in the securities or investments described herein (or options thereon) and/or otherwise employ trading strategies that may be consistent or inconsistent with the provided strategies."

By Richard krugel, PriceActionAndIncome.com
Are you sick of second-guessing your analysis? Or worse, putting in the hard work and following your strategy rules only to see your trades crash and burn before they reach your targets?
When most traders start out, they tend to believe that the more indicators they use the better their performance will be…
But this couldn’t be further from the truth!
Instead, a better place to start is to understand how markets move on a chart and WHY – without any indicators.
SHORT VIDEO PRESENTATION - Using Pitchforks to Spot Quality Entries and Exits
THE SPECIAL OFFER
Market Geometry Toolbox
The Market Geometry Toolbox is like a "Greatest Hits" collection of trading tools.
It's a complete package for analyzing the markets just like I do, and it includes every analytical tool that I use to trade the markets, all pre-loaded with my custom settings and exact specifications for using them effectively to find massive opportunities in a freely traded market.

Author: Richard Krugel
Company: Price Action
Websites: priceactionandincome.com
Services Offered: Training Courses and Trade Alerts
Markets Covered: Forex. Futures, Options
DISCLAIMER
"This eBook is for information purposes only. Any products or services offered or recommended are not endorsed by OptionPub and neither the company nor its affiliates bear responsibility or control over the content of the information and the product or service offered. There is a very high degree of risk involved in trading. Past performance is not indicative of future results. The profits and performance shown are not typical, we make no future earnings claims, and you may lose money. OptionPub and all individuals affiliated with this site assume no responsibility for your trading and investment results. The indicators, strategies, columns, articles and all other features are strictly for communication purposes only and should not be construed as investment advice. Information for any trading observations are obtained from sources believed to be reliable, but we do not warrant its completeness or accuracy, or warrant any results from the use of the information. Your use of the trading observations is entirely at your own risk and it is your sole responsibility to evaluate the accuracy, completeness and usefulness of the information. Your information may be shared with our educational partners. You must assess the risk of any trade with your licensed investment professional and make your own independent decisions regarding any securities or investments mentioned herein. Affiliates of OptionPub may have a position or effect transactions in the securities or investments described herein (or options thereon) and/or otherwise employ trading strategies that may be consistent or inconsistent with the provided strategies."
By Jeff Tomkins and Daniel Sinnig, ZillionTree.com

Have you ever wondered if trading indicators do more harm than good for traders? It’s a sensitive subject because most active traders and investors use indicators for technical trading. Using indicators is one best practice to identify high-probability trade entry and exit points. That is, if you are using them correctly. Trading Indicators are based on mathematical calculations which interpret different market properties like trend, momentum, volatility, and volume. Used correctly and you’re a hero. Used incorrectly, and it could spell disaster!
It can be daunting to know which indicators to use – are the settings ideal for your trading style and are market conditions ripe for your blend of indicators? Traders of all experience levels and backgrounds have risked their hard-earned money trying to find the Holy Grail of Indicators. We are not saying that we have found the Holy Grail, but we have found a couple of indicators when used together, gets us close. Our team of experts has spent many years researching, developing, and testing two of our most powerful proprietary indicators that are complementary and give outstanding results when combined. Before we reveal what they are, let’s talk about what makes them so effective.
What is Momentum and Trend Analysis?
Linear momentum is one of the most reliable ways to predict a security’s future price. Whether it is a stock, exchange traded fund (ETF), index, futures contract or Forex pair, momentum tells us who is in control – the bulls or the bears. It gives us a reliable indicator of which way the market is headed and when a new trend is setting in or an old trend is reversing. Imagine having access to this knowledge before placing your next trade. In this article, we will explain how you can accurately gauge future market direction and place more confident trades in any market and any timeframe.
First, let’s examine what linear momentum is and how it exhibits predictive qualities in the markets. In physics, linear momentum is defined as the product of a system's mass multiplied by its velocity. The greater an object's mass or velocity, the greater its momentum. When applied to the markets, we can replace the variable “mass” with the catalyst of buying and selling pressure. Once we determine whether buyers or sellers are moving prices, we can more confidently place our trades and try to stay on the right side of the predominant trend.
There are dozens of “momentum indicators” available on today’s retail trading platforms. Some are potentially more reliable than others. There are also many ways to interpret the data from these indicators and implement the output when placing a trade or incorporating the information into a trading system. Ultimately, we want a momentum indicator that tells us the strength, direction, momentum and duration of the trend in a security’s price. There is one particular indicator available on virtually any retail trading platform that does an incredible job at accomplishing all of these metrics: the MACD.
The MACD indicator, which stands for Moving Average Convergence/Divergence, is a trading indicator originally created in the late 1970s by Gerald Appel and used in the technical analysis of security prices. Appel designed this indicator to reveal changes in the strength, direction, momentum, and duration of a trend in a stock's price. Not only is this indicator accurate and versatile, but it can be applied to any market and any timeframe the trader chooses. While there are numerous ways to apply this momentum indicator, such as the identification of overbought/oversold conditions, one of the most reliable techniques to determine future trend momentum is the MACD cross.
The MACD is comprised of a 26-period Exponential Moving Average (EMA) and a 12-period EMA. By subtracting the 26-period EMA from the 12-period EMA, you get the MACD line. A 9-period EMA of the MACD called the "signal line," is plotted on top of the MACD line, which provides the buy and sell signals. In other words, the MACD cross indicates a shift in momentum when the fast line crosses above or below the slow line.
Let’s look at this on a daily chart of Apple, Inc. (Ticker: AAPL):
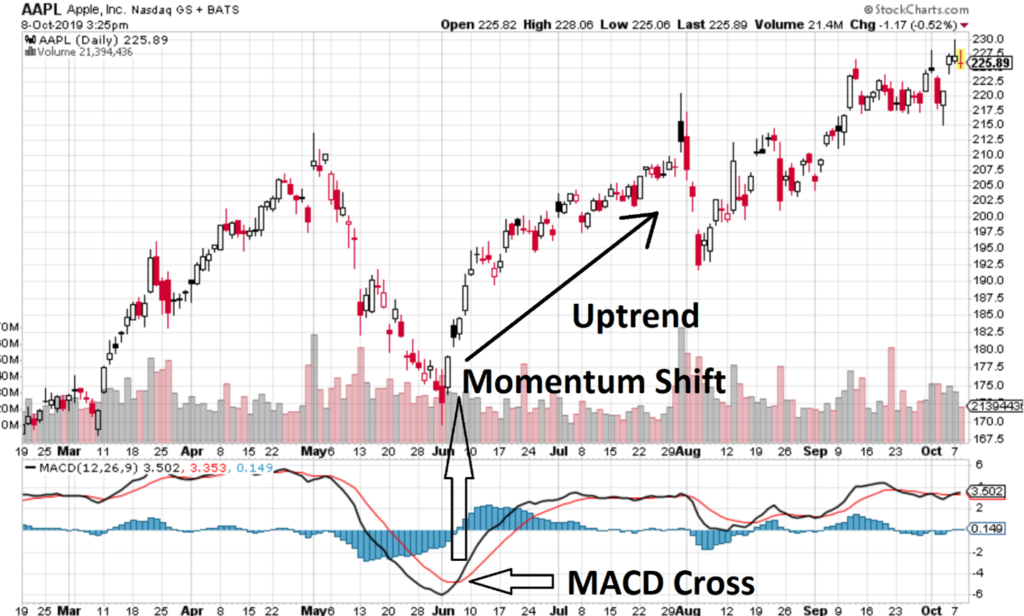
We can see the MACD cross that took place in early June when the signal line passed the MACD line following a steep sell-off, resulting in a buy setup. Over the next couple of months shares of Apple, Inc. rallied nearly 24%. In this scenario the MACD cross proved to be a very accurate indicator in terms of identifying the momentum shift and predicting a change in trend.
The MACD can also be combined with additional indicators to further strengthen signal accuracy. But, be aware that adding indicators of the same type may create redundant signals which can be misleading. For example, if you have two indicators which both calculate momentum, you may think that it provides additional confirmation. In reality it causes "multicollinearity" which is a statistical term that simply refers to multiple counting of the same information without adding additional insights. Believe it or not, this is not a good thing in trading.
To avoid this problem, it is important for traders to combine indicators that work well with each other. We recommend combining the MACD indicator with volatility divergence analysis, which we will introduce in the next section.
What is Volatility Divergence Analysis?
Volatility is defined as the range between the high and the low prices on any given day. Large ranges indicate high volatility whereas small ranges indicate low volatility. Interestingly volatility does not change randomly. Instead, it follows patterns which we, as traders, can take advantage of. One such pattern is the observation that for the vast majority of equities, the volatility on bearish days is higher than on bullish days. Let’s check out the figure below which depicts a relative comparison between the average volatility of bearish bars as compared to bullish bars across the S&P 500 stocks.
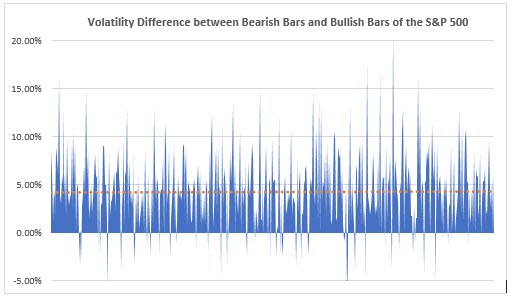
We can see that it is on average 5% higher – sometimes as much as 20% higher. This phenomenon can be explained as follows: Bearish bars, and more importantly down trends, are caused by sells offs which are often characterized by drastic price moves with high volatility. During these sell offs, investors are unloading their positions in a rather rapid fashion which causes swift price moves and increased volatility. Conversely when volatility is low, the market is considered as low risk which in turn encourages traders and institutions to re-invest into the market thus resulting in an uptrend.
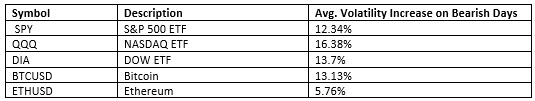
This phenomenon not only exists with individual stocks but also with large ETFs and even major crypto currencies.
Now that we are aware of this phenomenon how can we use it to further strengthen the MACD cross entry signal? The answer is Divergence!
A divergence is a discrepancy between price movement and a technical indicator. In other words, price is going up while the underlying indicator is going down, or vice versa. For example, price may show a downtrend whereas the indicator is going up. Clearly, there is a mismatch between these two which may indicate a reversal in the market.
But how does this help us? Let’s take this case by case.
Case 1: The MACD generates a potential Buy Signal as the MACD line crosses above the signal line (1). We then want to back this up as follows. Let’s check for an upward trending price (2) while the Volatility is declining (3). The screenshot below shows such a scenario.
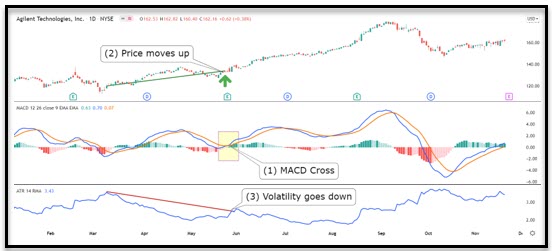
Not only did the MACD line cross with conviction above the signal line, but we also have a clear divergence between price and volatility. This is a solid setup with a lot of promise that the uptrend will continue for some time.
Case 2: The MACD line crosses below the signal line. We can strengthen this signal by ensuring that price is moving down and volatility is rising. This will increase the probability that a sell-off may occur and the downtrend will develop momentum.
The Missing Piece: Zillion Platform
Spotting ideal setups using momentum and volatility divergences is time consuming, especially on a daily basis. Manually analyzing one stock effectively could take as much as 20-30 minutes. Due to the sheer volume of stocks, finding these setups is not always feasible. In addition, good setups don’t present themselves often. But when they do, you don’t want to miss them.
Saying that, what if there was a sophisticated platform designed for traders that did all the heavy lifting and streamlined this complex process for you? To address this need, we’ve developed a platform that can do all of that and even more. Check it out here…
*Past performance is not indicative of future results.
THE SPECIAL OFFER
After spending over ten years educating traders, we’ve decided to compile our systems, methodologies and indicators into a very special dashboard called Zillion. The goal is to remove the guesswork from trading. Trading consistently is a challenge and finding ideal setups can be the hardest part, but it doesn’t have to be. Zillion’s powerful built-in scanner checks thousands of symbols every day for the next potential big move. Don’t worry about going through each symbol one by one. The scanner will tell you which symbols have a fresh setup in seconds, with just a few clicks.
Our team at Zillion has worked hard to build intelligent indicators which have predictive power. We take a unique approach to trading, where traders, software engineers and mathematicians come together to build innovative indicators. We use advanced calculations for our complementary indicators to make sure that our traders have the best tools at their disposal. The Zillion platform employs an optimized algorithm of the MACD cross system which will generate signals up to 3 bars earlier – thus getting you in at a much better entry price. We call this the “Trade Trend” entry. But there is more. Our team has created an innovative volatility divergence filter which will allow you to zoom in on the most profitable trades at a blink of an eye.
Everything at your fingertips from your browser, phone, or tablet. With Zillion, you can harvest incredible trade opportunities from the market with just a few clicks.
To help you get started, we have knocked the price down 50% to only $49 per month for a limited time. The Zillion Dashboard offers huge value without the hefty price tag. It’s made for Traders by Traders. To get started today, visit www.zilliontree.com.
Author: Jeff Tompkins, Daniel Sinnig
Company: Zillion
Websites: www.zilliontree.com
Services Offered: Trading Signals, Scanners, Market Analysis, Charting
DISCLAIMER
"This eBook is for information purposes only. Any products or services offered or recommended are not endorsed by OptionPub and neither the company nor its affiliates bear responsibility or control over the content of the information and the product or service offered. There is a very high degree of risk involved in trading. Past performance is not indicative of future results. The profits and performance shown are not typical, we make no future earnings claims, and you may lose money. OptionPub and all individuals affiliated with this site assume no responsibility for your trading and investment results. The indicators, strategies, columns, articles and all other features are strictly for communication purposes only and should not be construed as investment advice. Information for any trading observations are obtained from sources believed to be reliable, but we do not warrant its completeness or accuracy, or warrant any results from the use of the information. Your use of the trading observations is entirely at your own risk and it is your sole responsibility to evaluate the accuracy, completeness and usefulness of the information. Your information may be shared with our educational partners. You must assess the risk of any trade with your licensed investment professional and make your own independent decisions regarding any securities or investments mentioned herein. Affiliates of OptionPub may have a position or effect transactions in the securities or investments described herein (or options thereon) and/or otherwise employ trading strategies that may be consistent or inconsistent with the provided strategies."
By Melissa Armo, TheStockSwoosh.com
Regardless of whether you have made or lost money this year, now is the time to start thinking about your trading goals for 2022. This should not be a big undertaking but will require that you sit down one morning and map out a plan of action for the next calendar year.
Start by asking yourself where you want to be one year from now? How much money you want to make trading? Are your current trading strategies working for you or do you need to research new strategies, markets and/or instruments to trade? If you lost money this year, this is especially important for your to do.
Hi there, my name is Melissa Armo and I am a big believer in building and executing a success-oriented personal trading plan and in this short video, I am going to share my favorite strategy for consistently making money in the markets. This is a strategy that I have perfected over time and is the central component of my trading plan...
SHORT VIDEO PRESENTATION: PLANNING FOR PROFITS IN 2022
THE SPECIAL OFFER
The Golden Gap Course
Get my comprehensive course and live training for trading the markets.

Author: Melissa Armo, Founder
Company: The Stock Swoosh
Websites: TheStockSwoosh.com
Services Offered: Trading Rooms, Trading Courses, Newsletters
Markets Covered: Stocks, Options
DISCLAIMER
"This eBook is for information purposes only. Any products or services offered or recommended are not endorsed by OptionPub and neither the company nor its affiliates bear responsibility or control over the content of the information and the product or service offered. There is a very high degree of risk involved in trading. Past performance is not indicative of future results. The profits and performance shown are not typical, we make no future earnings claims, and you may lose money. OptionPub and all individuals affiliated with this site assume no responsibility for your trading and investment results. The indicators, strategies, columns, articles and all other features are strictly for communication purposes only and should not be construed as investment advice. Information for any trading observations are obtained from sources believed to be reliable, but we do not warrant its completeness or accuracy, or warrant any results from the use of the information. Your use of the trading observations is entirely at your own risk and it is your sole responsibility to evaluate the accuracy, completeness and usefulness of the information. Your information may be shared with our educational partners. You must assess the risk of any trade with your licensed investment professional and make your own independent decisions regarding any securities or investments mentioned herein. Affiliates of OptionPub may have a position or effect transactions in the securities or investments described herein (or options thereon) and/or otherwise employ trading strategies that may be consistent or inconsistent with the provided strategies."
By Steven Primo, ProTraderStrategies.com

How would you like to trade with clear and precise entry points including a high probability of catching the big trend? And how would you like to know all of these parameters before you even entered the trade? Join Steven Primo, Former Stock Exchange Specialist and 44-year professional trader, as he reveals “How To Become A Consistent Trader In 4 Simple Steps!” In this educational presentation Steven will not only walk you through the simple step-by-step process but share recent trading examples of this technique including:
Whether you are a seasoned pro or new to trading, you can’t afford to miss this special educational presentation.
SHORT VIDEO PRESENTATION: HOW TO BECOME A CONSISTENT TRADER IN 4 SIMPLE STEPS
THE SPECIAL OFFER
Get a 30-Day Trial of My PTS Primo Charts Program for just $7!
What you will get:
- A full, 30-day trial of my program for just $7
- You will get the trading strategy discussed in this video (Trading Strategy 3a)
- "STEPS" 1 & 2 Entry Techniques for fine-tuning your entries into trades
- Strategy Signal Scanner - Know which markets are triggered, according to the strategy
- Enhanced "BUY/SELL" line, which signals when markets are trending up or down
- Over 90 Technical Indicators
- Free Bloomberg TV for fundamental analysis
- Personalized Tech support for your individual needs

Author: Steven Primo, Founder
Company: Pro Trader Strategies, Specialist Trading
Websites: ProTraderStrategies.com, SpecialistTrading.com
Services Offered: Trading Courses, Trade Signals, Member’s Section, Videos
Markets Covered: Stocks, Emini Trading, Forex, Day Trading, Swing Trading
DISCLAIMER
"This eBook is for information purposes only. Any products or services offered or recommended are not endorsed by OptionPub and neither the company nor its affiliates bear responsibility or control over the content of the information and the product or service offered. There is a very high degree of risk involved in trading. Past performance is not indicative of future results. The profits and performance shown are not typical, we make no future earnings claims, and you may lose money. OptionPub and all individuals affiliated with this site assume no responsibility for your trading and investment results. The indicators, strategies, columns, articles and all other features are strictly for communication purposes only and should not be construed as investment advice. Information for any trading observations are obtained from sources believed to be reliable, but we do not warrant its completeness or accuracy, or warrant any results from the use of the information. Your use of the trading observations is entirely at your own risk and it is your sole responsibility to evaluate the accuracy, completeness and usefulness of the information. Your information may be shared with our educational partners. You must assess the risk of any trade with your licensed investment professional and make your own independent decisions regarding any securities or investments mentioned herein. Affiliates of OptionPub may have a position or effect transactions in the securities or investments described herein (or options thereon) and/or otherwise employ trading strategies that may be consistent or inconsistent with the provided strategies."

By Silas Peters, SeasonalSwingTrader.com
In this chapter, I am going to share how I trade Historically reliable seasonal patterns AND coupled with Historically reliable chart pattern analysis.
When you combine the two together, any trader can put significant odds in their favor to capture seasonal trends and project moves as dictated by simple chart patterns.
Drumroll...Here is the Setup!
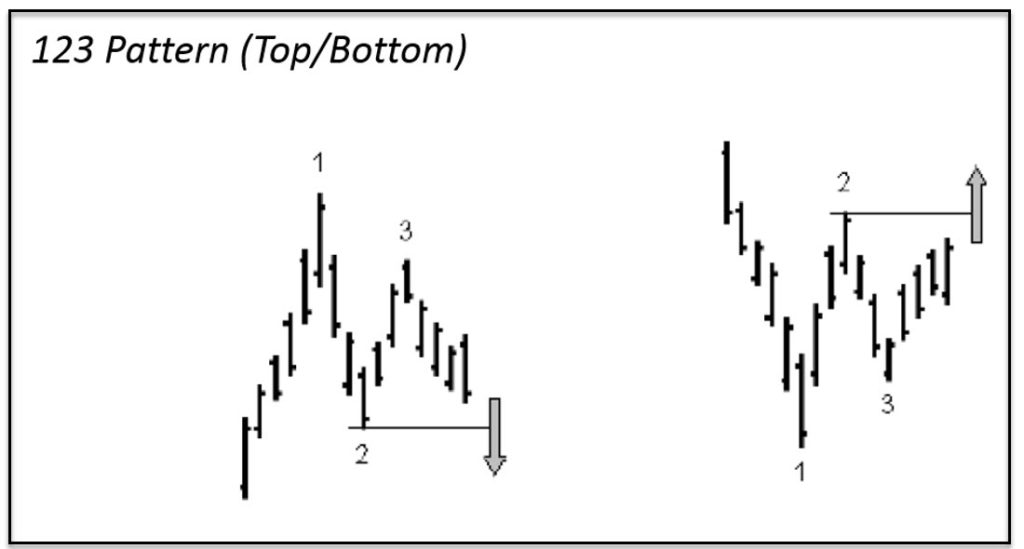
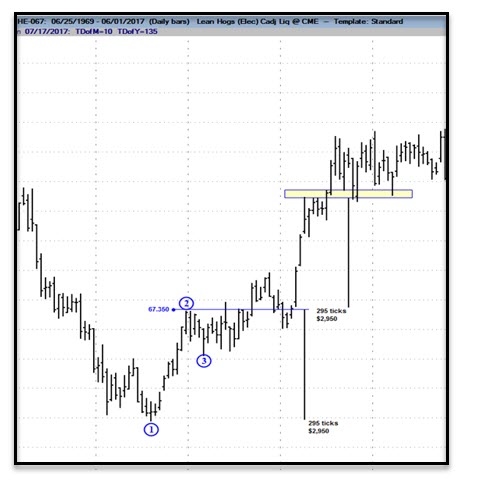
This pattern is sometimes referred to as the (A-B-C) Top/Bottom. It anticipates a change in trend from up tp down on a break below the “2” or “B” point. It anticipates a change in trend from down to up on a break above the “2” or “B” point. It is because the market fails to make a higher high or a lower low … the market is exhausted and ready to turn the tide so to speak.
Generally speaking, the more bars it takes to complete the pattern, the bigger the move, and the more accurate the signal will be. Again, confirmation of entry is on a break OR close above or below the “2” point.
Let’s look at some examples to put this into context:
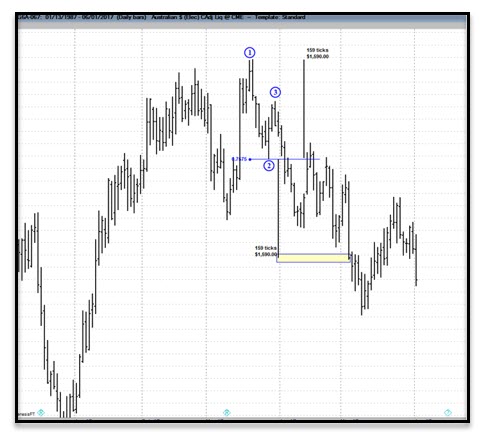
123 TOP - Australian Dollar
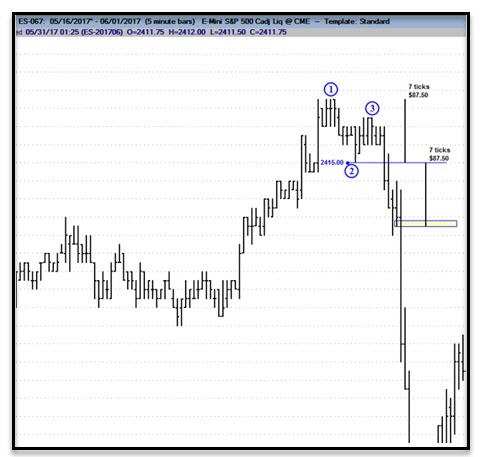
As I said earlier, we can trade this setup (“pattern”) on an intraday basis as well - see below a 5m chart of the ES (Emini SP 500).
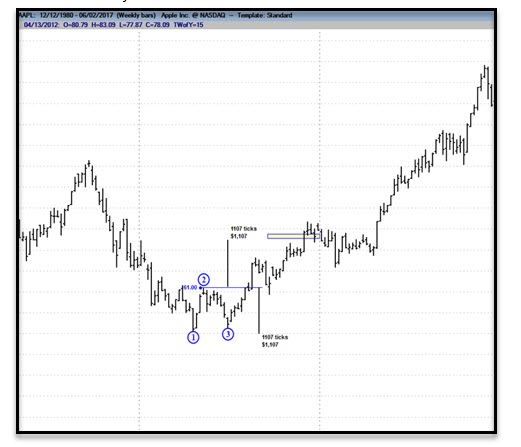
Here are a couple of examples of the 123 Bottom - same rules as the 123 Top but inverse. See this Daily Chart of Lean Hogs --
And this Weekly chart of AAPL --
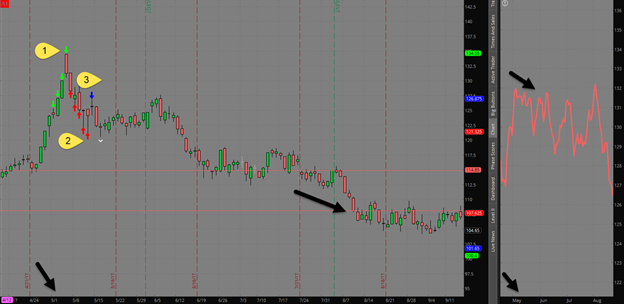
Okay, so by now you should be able to see how this very simple pattern works on any market and any timeframe. Let’s take a quick glance on how to incorporate with seasonality. Below is a Daily Chart of Hess Corp (HES). I have used drawing tools (yellow “1-2-3”) to illustrate the 123 bottom that formed in August. We have also added a free study that is included in the ThinkorSwim platform - the Seasonality Indicator
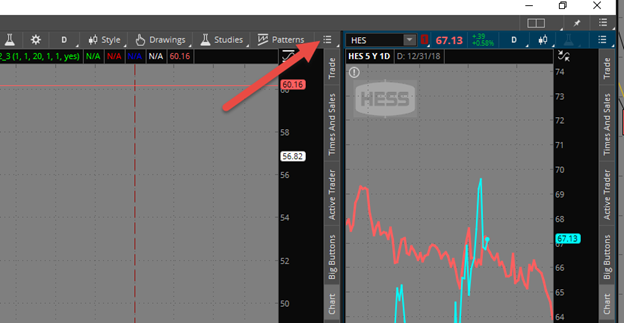
**To add, go to top right-hand corner of chart, select the 3-bar “sandwich” button, go to Style>Chart Mode>Seasonality. The turquoise line is the actual price; red line is seasonal price average
So, if we take a glance at what HES does on a historical seasonal basis, you can see that HES typically experiences strength in the late August / early September time period. This helps us with further confirmation on getting long, since we also have a 1-2-3 bottom formation taking place.
Once the price broke above the most recent red arrow (the #2 point), that was a trade confirmation. A more conservative entry is to wait for a solid close above the breakout point (#2), or wait for a retest of the breakout area - which we got both. Then, as you can see, the profit target was reached in approximately 10 trading days. Again, you know BOTH your profit and risk beforehand, and you can place your orders accordingly.
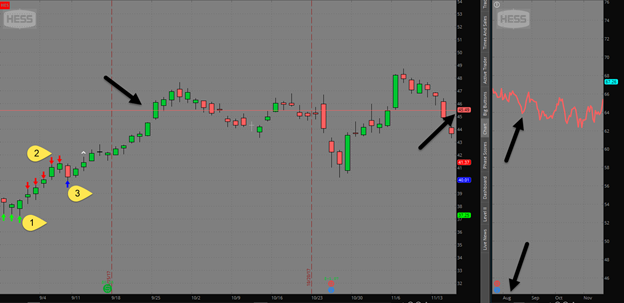
This trade was good for a little over $4.00, or $400 per 100 shares traded.
A trader in this example could have:
Let’s take a look at one more example - this is a daily chart on Live Cattle (/LE):
Here, we have a 1-2-3 Top formation that formed in May. From a seasonal perspective, we also know that the Cattle market tends to “top” out during this time period, thus indicating we have a high-probability trade at hand.
Approximately 3 months later, Cattle reached its profit objective of 13 points at 107.65, which is $5200 per single contract traded.
This is a trade that can be replicated by shorting Live Cattle futures, buying puts or put spreads or selling call spreads.
I hope that you have enjoyed this report and can see the importance of adding the 123 top and bottom pattern coupled with seasonality as part of your overall trade plan. Whether you are a stock, futures or options trader, Seasonal Swing Trader has a trade idea for you.
THE SPECIAL OFFER
Get Lifetime Access to the 3S Code Pro Indicator
YOU WILL ALSO RECEIVE THE FOLLOWING BONUSES:

Author: Silas Peters
Company: Seasonal Swing Trader
Websites: SeasonalSwingTrader.com
Services Offered: Trading/Investing education, trade ideas, courses, indicators, scanners, seasonality software
Markets Covered: Stocks, ETFs, Commodities, Futures, Forex
DISCLAIMER
"This eBook is for information purposes only. Any products or services offered or recommended are not endorsed by OptionPub and neither the company nor its affiliates bear responsibility or control over the content of the information and the product or service offered. There is a very high degree of risk involved in trading. Past performance is not indicative of future results. The profits and performance shown are not typical, we make no future earnings claims, and you may lose money. OptionPub and all individuals affiliated with this site assume no responsibility for your trading and investment results. The indicators, strategies, columns, articles and all other features are strictly for communication purposes only and should not be construed as investment advice. Information for any trading observations are obtained from sources believed to be reliable, but we do not warrant its completeness or accuracy, or warrant any results from the use of the information. Your use of the trading observations is entirely at your own risk and it is your sole responsibility to evaluate the accuracy, completeness and usefulness of the information. Your information may be shared with our educational partners. You must assess the risk of any trade with your licensed investment professional and make your own independent decisions regarding any securities or investments mentioned herein. Affiliates of OptionPub may have a position or effect transactions in the securities or investments described herein (or options thereon) and/or otherwise employ trading strategies that may be consistent or inconsistent with the provided strategies."
By Larry Gaines, PowerCycleTrading.com
The markets have been on a fantastic run to the upside, and the higher the markets climb, the closer we are likely getting to a potential looming and inevitable fall. No one knows the exact timing of the next major market correction, but in this video, I'm going to layout a dynamic options strategy that can be used for hedging your trading or your investing gains.
I call this the Protective Collar Option Strategy and it combines two option techniques (a protective put and covered call) that generates income if the stocks you are long in should go down. This way you can place conservative trades in a market that may be topping out and are protected on the downside while retaining opportunity to the upside.
In this short video, I will take you step-by-step on how to set up a protective collar option trade that can be used to protect your overall portfolio, as well as take advantage of individual trades...
SHORT VIDEO PRESENTATION: HEDGING YOUR GAINS WITH THE PROTECTIVE COLLAR OPTIONS STRATEGY
THE SPECIAL OFFER
Test Drive My Power Cycle Trading Club Here
If you would like to learn more about trading price direction, options and much more then I hope you’ll take this opportunity to Test Drive My Power Cycle Trading Club by clicking on the button below.

Author: Larry Gaines, Founder
Company: Power Cycle Trading
Website: PowerCycleTrading.com
Services Offered: Trading Courses, Bootcamps/Coaching, Custom Indicators
Markets Covered: Stocks, Options, Futures
DISCLAIMER
"This eBook is for information purposes only. Any products or services offered or recommended are not endorsed by OptionPub and neither the company nor its affiliates bear responsibility or control over the content of the information and the product or service offered. There is a very high degree of risk involved in trading. Past performance is not indicative of future results. The profits and performance shown are not typical, we make no future earnings claims, and you may lose money. OptionPub and all individuals affiliated with this site assume no responsibility for your trading and investment results. The indicators, strategies, columns, articles and all other features are strictly for communication purposes only and should not be construed as investment advice. Information for any trading observations are obtained from sources believed to be reliable, but we do not warrant its completeness or accuracy, or warrant any results from the use of the information. Your use of the trading observations is entirely at your own risk and it is your sole responsibility to evaluate the accuracy, completeness and usefulness of the information. Your information may be shared with our educational partners. You must assess the risk of any trade with your licensed investment professional and make your own independent decisions regarding any securities or investments mentioned herein. Affiliates of OptionPub may have a position or effect transactions in the securities or investments described herein (or options thereon) and/or otherwise employ trading strategies that may be consistent or inconsistent with the provided strategies."
marina Villatoro, The TraderChick.com
Ready for a secret hack when it comes to wins and losses with our trading? I’m Marina ‘The Trader Chick’, and today I'm going to give you a little trick for your trading wins and losses. Once you learn this, I know you will take your trading to the next level and start profiting consistently and with simplicity.
To begin with, let me tell you something. There is a thing called 'threshold' for your wins and for your losses.

So let me explain a bit what that means. Here's the reality, guys, everybody wants to make a ton of money. Who doesn’t want that, right.
I hear a lot of people saying ALL.THE.TIME: "I want to make a $1,000 a day",or "I want to make $500 per day."
Meanwhile, they're barely breaking even and even worse, making negative $50 to $100 a day.
Yettt…. In the same breath, getting greedier, saying things like: "I can make more. I could do more. I need to make more." Like they are entitled to make all this money, while not having a strategy or learning what to do.
But here’s the thing!
We have to have a threshold. A threshold for losses.

And, what nobody talks about is the ‘wins’ threshold. Which, I know is almost if not AS important as the loss for the day threshold.
Before we move on to the win threshold, what does the loss threshold really mean? Basically, it means how much money are you truly willing to lose for one day. But that takes into account that you actually have risk management in place, your stop loss. Because many people have a mental STOP loss in place.
Have you heard of that mental stuff, or how many times have you lied to yourself about the ‘mental stop’?
Yeah, I've been there. I've done that. I've lost several accounts. So what happens when we have a mental stop? The ego will always win.
Right. And we will never permit ourselves to admit that we're losing. If we are trained as strategic traders, we should have a risk in place. Plain and simple. No if ands or buts, it’s there without moving!
That way, we are telling the market this is all I'm willing to risk on this particular trade. You are in full control of that!
And what you're also doing is you are setting a very specific amount of loss for the trading day. Whatever your loss threshold is, let's say it's $100 or $200. It depends on you. You NEED to stick to that threshold.
We ‘get it’ to some extent, however, what people don't understand and never, ever consider is that there is such a thing as a win threshold.
What is a ‘win threshold' really mean?
It means you should also tell yourself the amount of wins you are going to permit yourself to have for the day. You have to be reasonable and realistic. Why? Because there is this thing called energy and energy exertion.
So we understand if we are taking trades that we are performing like an athlete. We have a practice and backtested, with the facts of our trade setups and their probabilities. We have a strategy and plan. Just like an athlete who has their technique worked out and practiced.
The best athletes regardless if they are scoring goals or missing passes, have their threshold. They know how much they can continue to play at top performance, and rarely do they push it. Because then it becomes fatigue and that can lead to disaster no matter how you pretend it won’t.
Energy exertion happens if you are winning or if you are losing.
Let me explain in detail. When you are taking a certain amount of trades, it doesn't matter if they end up winners or losers. You're sitting in front of the market and you are watching the market and you're seeing what's happening in the market. All this is activity. You're seeing the trade happen, and you put in that trade, you enter the trade, you're sitting there, and you win.
So what happens all that time? Your mind has been working. You might not be exercising, but you're using your mind, and it's a very exhausting activity.
So you're already using energy. And even if you win, you're all excited. More energy. We as traders, as humans, only have a certain amount of energy that we could really put in.
I'm going to give you an example. Michael Jordan, Michael Phelps. We know these names. These are the best athletes in the world.
I could go into many more. These guys are the best they could get. They know that they could probably only put in their best for an hour and a half, maybe two hours tops of their full on performance and energy.
And these guys train 8 hours per day.
They have been training for 20 years.
They are the MASTERS.
They know their exertion limit.
Yet, us day traders, we don't know that.
Not only that, but aspiring day traders think, "I can go for another trade." But they forget that their energies are done!
We as traders never want to go into emotional trading. That's when we stop being rational and stop taking valid trades.
Now, let’s look at the other side of the coin. We've just taken a trade that we know we can win, but sometimes the trade loses, and it sucks. Even if you know that particular type of trade wins 80% or 90% of the time. But in trading, this is normal!
Losses happen!
Guess what?
You just used energy. And you've actually used even more energy. Because it's an emotion that brings a negative reaction. Especially when we take a losing trade.
Going back to that analogy of Michael Jordan, and Michael Phelps. They're winning, and they're using energy. And they know that because they could only do a certain amount even if they're losing.
Another way to look at it, take out your phone. It’s been working all day, and you’re down to about 1%. When your phone is that low, would you take a super important call that can change your life?
Absolutely not, you know you need to charge it because what if it dies right in the middle of the thing that can actually be that game changer.
We humans are like phones, we need to recharge! We can’t be going full on all the time?
Back to trading, we'll use less energy when we're winning, which is understandable. But we're still using energy. We are still exerting ourselves. Now, if you're taking two or three losses in a row, your energy is going to go down super quick.
What does that mean?

Your battery is going to go down really quickly. You can become emotional a lot faster. You, as a trader, it is your job to stay strategic and tactical. And not emotional, that way you can be taking valid trades, and making good decisions.
So here's my exercise for you guys.
And I'm not even talking about the actual dollar amount, which is very important.
But also, sometimes you'll take three losing trades, and it won't come up to that dollar amount. But look at your energy. You'll see that your energy gets low.
What do you do about that? And what is your threshold? What is your threshold for losing trades? Because remember, we are like the phone.
If I'm going to be on my phone with a Zoom call that's going to take up my battery quicker. I know that I need to charge it. It's not going to go that much longer versus if I'm just scrolling around, and that could last a lot longer.
So you guys have to be responsible and that is your job as the trader.
That is my secret hack to you guys.
Understand your threshold.
THE SPECIAL OFFER
Did you know that Day Trading is over 80% mental strength?
I have a special mental training for Day Traders for $37 with bonuses that will definitely take you to the next level:

Author: Marina Villatoro, Founder
Company: The Trader Chick
Website: TheTraderChick.com
Services Offered: Trading Education, Boot Camps, Trading Community
Markets Covered: Futures, Equity Indices and Commodities
DISCLAIMER
"This eBook is for information purposes only. Any products or services offered or recommended are not endorsed by OptionPub and neither the company nor its affiliates bear responsibility or control over the content of the information and the product or service offered. There is a very high degree of risk involved in trading. Past performance is not indicative of future results. The profits and performance shown are not typical, we make no future earnings claims, and you may lose money. OptionPub and all individuals affiliated with this site assume no responsibility for your trading and investment results. The indicators, strategies, columns, articles and all other features are strictly for communication purposes only and should not be construed as investment advice. Information for any trading observations are obtained from sources believed to be reliable, but we do not warrant its completeness or accuracy, or warrant any results from the use of the information. Your use of the trading observations is entirely at your own risk and it is your sole responsibility to evaluate the accuracy, completeness and usefulness of the information. Your information may be shared with our educational partners. You must assess the risk of any trade with your licensed investment professional and make your own independent decisions regarding any securities or investments mentioned herein. Affiliates of OptionPub may have a position or effect transactions in the securities or investments described herein (or options thereon) and/or otherwise employ trading strategies that may be consistent or inconsistent with the provided strategies."
By Serge Berger. The SteadyTrader.com
You may want to trade because of your interest in the financial markets and strong aspirations of becoming more active about managing your finances. Or you may want to trade because you’ve earned enough money and now want to be free of a boss, enjoy life, and yet still earn an income.
Whatever the reason for being interested in a more active investing/trading approach, this profession if approached the right way will allow you to actively manage money in all market situations while having the freedom to work for yourself. All the while you will want to be a student of the markets and gain an appreciation for some of the things that are critical for success as a trader.
Investors and traders are often overwhelmed by the choices available to them. From stocks and exchange traded funds (ETFs) to options and more, at the outset it can seem like an endless journey.
After 20 years as a professional trader, I can tell you that the simpler one’s approach to trading the stock market the better the returns over time and that mastering just a few specific chart patterns can make a massive difference in one’s portfolio returns.
You see, stocks, indices and other asset classes often form predictable patterns with decisively bullish or bearish outcomes. The fact is that being able to recognize these patterns as they develop, and pouncing on the confirmed high-quality signals, over time can amass wealth beyond your wildest dreams. Be persistent, specific, and patient!
Chart Pattern Types
Pick any random book on technical analysis off the library shelf and you are likely to encounter more ‘chart pattern’ types than you can shake a stick at. While surely most of these patterns have some merit, the fact is that only a few of them occur frequently enough and even fewer flash high probability signals to make them worth learning and paying attention to.
The chart patterns I discuss in this eBook are the ones that have given me a great edge over the course of my trading career. They have not just helped me reap great profits but also allowed me to contextualize trade setups and helped me analyze the broader markets. Lastly, these patterns allowed me to navigate the markets with good risk management, i.e., well defined stop-loss and profit targets.
As a big advocate of keeping things simple, I find that all of my high probability chart patterns fit into one of these three categories:
▪ Trend Reversals
▪ Trend Continuation
▪ Mean-reversion (i.e. overbought/oversold)
Trend reversal patterns signal the end of a trend in any given time frame and set up high probability trades in the new (opposite) direction
Trend continuation patterns or ‘consolidation patterns’ take place along an existing trend. After a stock in an up-trend gets near-term overbought it will slip into a consolidation phase to work off those overbought readings. The inverse happens on down trends. After some time these overbought readings have subsided and investors once again find enough appetite to push the stock higher along the primary trend and out of the consolidation pattern. Again, the inverse holds true for stocks in down-trends.
Mean-reversion patterns form when a stock becomes overbought or oversold and signals that it is in need of a pause and move lower (in up trends) or bounce (in down trends) before possibly resuming along it primary trend.
Traders and investors alike often fall into the trap of thinking they need to need to be able to determine whether a stock is about to end its trend or is just taking a pause. Focusing on high probability patterns solves this problem and allows investors to focus on profits.
Chart Patterns
Head & Shoulders Pattern
The formation of a head and shoulders pattern is one indication that a rising stock may be reversing its course.
Why it works
One of my key market observations over the years has been that stock market tops are process, i.e. take time, while stock market bottoms are points, i.e. happen quicker. The head and shoulders pattern represents this observation. The process by the bulls to hand the baton over to the bears takes time. But once it's obvious this has taken place, then a great trading setup takes hold.
How it works...
The bulls are large and in charge but by the time they reach the ‘left shoulder’ of the pattern (left- most box on chart) they start to exhibit some exhaustion. After a little pause they attempt one more exhaustion rally that forms a higher high and thus the ‘head’ of the formation. This move signaled peak bullishness. The stock then drops but does not yet fall apart and begins developing the right shoulder. All of this is taking place above the ‘neckline,’ which is the black horizontal on the chart. The pattern triggers once the stock breaks below the neckline. A simple first profit target is measured by taking the difference between the neckline and the top of the head and subtracting it from the neckline.
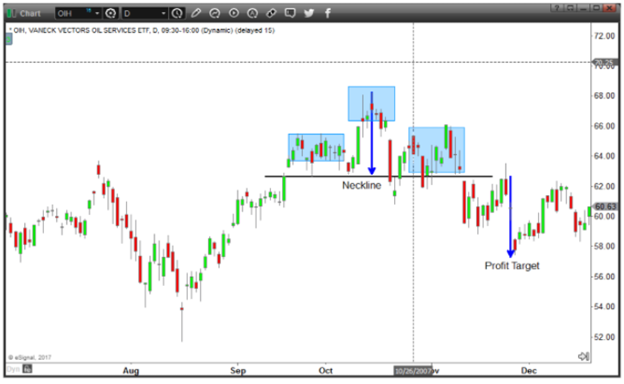
Inverse Head & Shoulders pattern
As the name indicates, the inverse head and shoulders pattern is literally the inverse of the ‘regular’ head and shoulders pattern. This pattern is one indication that a falling stock may be reversing its course higher.
Why it works
While bottom formations in stocks have a greater tendency to be briefer in nature than topping processes, bottoms can still take some time. Once it becomes apartent that a bottom has built, bulls get more confident and price begins to accelerate higher, which is what this pattern shows.
How it works...
We apply the same strategy as with the regular head and shoulders pattern, just inverse. Once the stock breaks above the neckline the signal triggers. The first upside price target is measured by taking the difference between the head and the neckline and adding it to the neckline - as the image shows. One thing about these patterns is that before the first price target is reached it is not to be ruled out that a re-test of the neckline takes place. In the example here this is exactly what happened. This re-test should not lead to a stop-loss trigger because more often than not the retest is a healthy move that ultimately leads to a move back higher to the first price target or beyond.
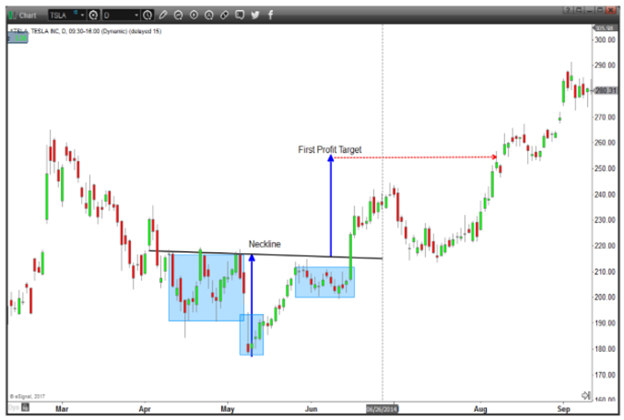
Rising Wedge Pattern
A rising wedge, in its traditional sense is a bearish pattern. The rising prices in an ever narrower trading range signal that the security is likely nearing a consolidation period where the stock trots sideways or begins to fall. In extreme cases the trendlines of this pattern converge, with both trendlines slanted in an upward direction.
Why it works
As a stock or other asset moves higher and complacency among investors begins to increase. The more investors ‘chase’ a stock higher the steeper the slope and the more narrow the rising wedge pattern becomes. The rising wedge pattern thus in that sense represents greed and fear of missing out on the part of traders and investors.
How it works
The price movement is bounded by the two converging trendlines. As the price moves towards the apex of the pattern the end of the pattern is nearing. Finally, only a clear move below the lower support line would be viewed by traders as a reversal in the upward trend. For traders focusing on daily charts, a daily close below the lower support line is needed to confirm the triggering of this bearish pattern.
Put differently, as the strength of the buyers wears off, the sellers start to gain momentum. The pattern is complete once the sellers visibly take control of the security, by pushing the price below the supporting trendline.
Typically, a good first downside price target is 50% of the distance of the low of the rising wedge and the top of the wedge.
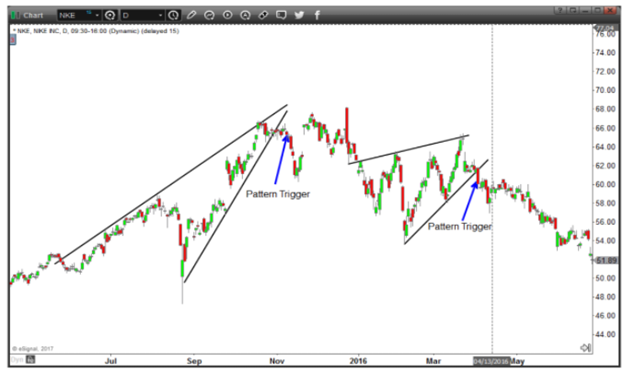
Falling Wedge Pattern
Whereas the rising wedge is a bearish pattern, the falling wedge is its bullish cousin.
The falling prices in an ever-narrower trading range signal that the security is likely nearing a consolidation period where the stock trots sideways or begins to break higher. In extreme cases the trendlines of this pattern converge, with both trendlines slanted in a downward direction.
Why it works
As a stock or other asset moves lower and bearishness/negativity among investors begins to increase. The more investors sell a stock as fear spreads the steeper the slope and the narrower the falling wedge pattern becomes. The falling wedge pattern thus in that sense represents pure fear as everyone runs for the exit.
How it works
The price movement is bounded by the two converging trendlines. As the price moves towards the apex of the pattern the end of the pattern is nearing. Finally, only a clear move above the upper resistance line would be viewed by traders as a reversal in the downward trend. For traders focusing on daily charts, a daily close above the upper resistance line is needed to confirm the triggering of this bullish pattern.
Put differently, as the strength of the sellers wears off and maximum bearishness is reached, the buyers start to gain momentum. The pattern is complete once the buyers visibly take control of the security, by pushing the price above the resistance trendline.
Typically, a good first upside price target is 50% of the distance of the high of the falling wedge and the bottom of the wedge.
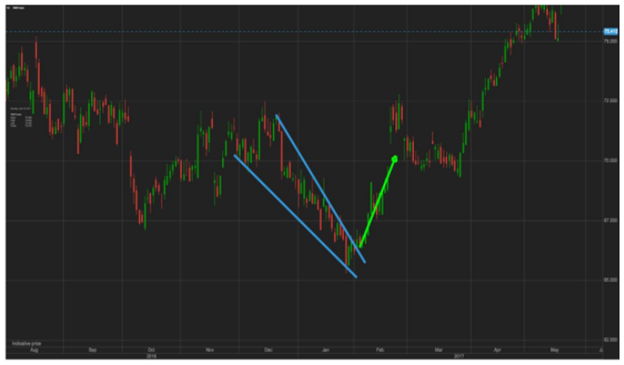
Flags, wedges, and pennant patterns
These are important patterns but rather than picking these three types of patterns apart into different categories let’s recognize that in essence they are all ‘consolidation’ patterns. What these patterns have in common is that they represent an asset consolidating a rally (or selloff), which then ultimately stands a good chance of continuing in the primary direction.
In fact, these three pattern types are so similar that one could with only little imagination (for example) draw a pennant formation out of a flag formation.
Why it works
After a stock rallies for some time it ultimately reaches a price level where investors (all else being equal) are no longer willing to buy the stock for the time being. The reasons why investors stop buying the asset will vary depending on their respective time frames and can range from short term momentum (overbought) to more fundamental reasons. However, because from the world of physics we learn that an object in motion stays in motion with the same speed and in the same direction unless acted upon by an unbalanced force, ultimately after some consolidation the odds favor that the stock will resume its primary trend higher. The inverse works for assets that are falling.
How it works
Generally speaking, the tighter and more well defined a consolidation pattern the better and more straightforward it is to profit from. Why? Because the tighter the pattern the better a trader and investor can define his or her risk.
On the below two charts I drew in the flag pattern, the pennant pattern on one chart and the sideways consolidation pattern on a separate chart. Much like other patterns already discussed above in this eBook, a valid trigger of these consolidation patterns does not occur until a clear breakout has taken place on whatever time frame one is focused on. For example, a trader or investor focused on charts with daily increments, a valid breakout of either a pennant, flag or sideways pattern does not trigger until a visually clear breakout has taken place on a daily closing basis.
Targets and stops:
One of the keys to consistent profits in the stock market is to be consistent and clear with profit targets and stop losses. A simple but effective way to measure the first upside price target in any of the three aforementioned consolidation patterns (once a breakout has occurred) is to add the distance of the rally leading up to the top of the pattern and add it to the breakout point.
For example, on the flag pattern example on the chart below, the first upside price target is measured by taking the distance between the rally that preceded the top of the flag pattern and adding that to the breakout point where the stock began to break out of the pattern.
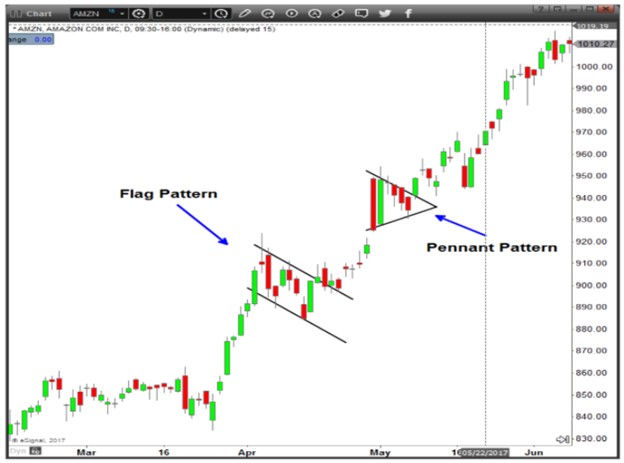

Island Reversal
Island reversals, however silly the name is, are some of the most powerful reversal patterns. After fifteen years of watching this pattern, I have no doubt that upon completion of such a pattern, a very high probability trade sets up. This pattern comes both in the bullish and the bearish variety.
Why it works
(Below I describe the bearish island reversal. For the bullish island reversal, the inverse holds true) Like any reversal pattern, the island reversal is a sign of buyer exhaustion, i.e., maximum bullishness/greediness is reached. Often times in a last attempt of buying desperation the greedy bulls will give it all and chase a stock higher regardless of price, valuation or any other possible analytics. This can lead to exhaustive final up-gaps, which then however mark a near, intermediate term or possibly even a longer-term top in a stock or other asset.
How it works
The island reversal has this name because it is the result of an up gap, followed by a down gap sometime later. This leaves an island or price action remotely alone atop the chart, which clearly marked the exhaustion buying, i.e., maximum bullishness within any given time frame.
Looking at the pattern example on the chart we see that this stock rallied for weeks but after a final up-gap the bulls finally had enough. This however is not clear until we see a down-gap of equal or greater size as the final up-gap, because the down gap confirms that the most recent price action preceding it was just a last gasp exhaustion buying.
A first price target following a confirmed island reversal then becomes the 50% mark of the most recent rally.
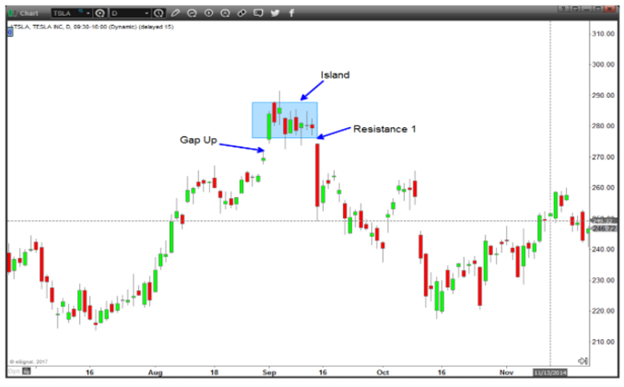
Cup and Handle
A cup and handle chart pattern resembles just that, the profile of a cup with a handle. The cup has a ‘U’ or even a ‘V’ shape of sorts and the handle has a slight downward drift. The right-hand side of the pattern typically has low trading volume.
The classic ‘cup and handle’ pattern definition has great focus on the how long it ‘should’ take to form the various stages of the pattern. In my eyes that is less important, particularly if one only takes a trade when a qualified signal from the pattern actually flashes. Namely, upon the confirmation of a breakout and not in anticipation of it.
In other words, don't get too detailed about all the small intricacies of various patterns or you will lose sight of the bigger picture. This holds true for all technical patterns. In reality most patterns rarely show up in their perfect academic state but rather take slightly less perfect forms.
Why it works
The cup-and-handle pattern is a consolidation pattern that represents the consolidation of a stock within its primary up trend. Much like the aforementioned flags, wedges and box patterns, along this consolidation path some weaker investors leave the market and new buyers, and steadfast holders stay in the security.
The only real difference is that the cup and handle is a slightly more complicated consolidation pattern but ultimately offers just many high probability trading and investing signals as the simpler patterns.
How it works
Although the classic textbook cup formation is truly round, if over the years I had only focused on taking these ‘perfect’ formations I would have left much money on the table. The reality is that markets don’t trade in a linear fashion and will thus also not act in a perfectly geometrical matter either when it comes to patterns.
The cup of the formation is the consolidation phase which shows buyers getting exhausted and some weak holders of the stock jumping ship.
As the market begins to rally again and the right side of the cup completes its formation, another round of nervous investors jump back out when the price gets back to the previous highs, i.e. the highs of the left side of the cup as they get to ‘breakeven’ on their positions. This then leads to the handle of the pattern.
The handle ultimately completes the pattern and results in a buy signal. The handle is the downward move by the security after the upward move on the right side of the cup. Traditionally speaking, if the handle is downward moving then the handle's downward movement can retrace up to one-third of the gain made in the right side of the cup.
During this downward move where some investors get back out of the stock, a descending trendline can be drawn. A move by the security back above this descending trendline is a signal that the prior upward trend is set to begin.
Alternatively, a more conservative breakout signal would flash if the security breaks above the price point of the two peaks in the cup. This is the price where the initial upward trend peaked and the point where the cup's upward move on the right side peaked before entering the handle. A breakout above this point is a strong signal that the prior uptrend is set to resume.
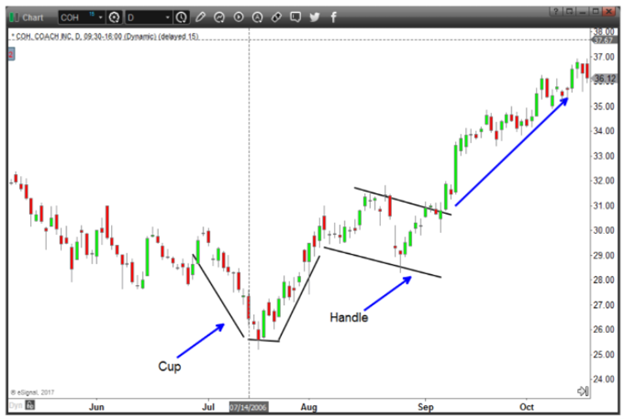
Simple support & resistance lines
While all of the above patterns are high probability in nature, the one common denominator is that they all ultimately must punch above or below a well-defined line of resistance or support in order to trigger a trading or investing signal.
Why it works
A pattern is just a pattern until it breaks a price area on the chart around which the pattern is based. Once this price area is broken the momentum in that direction tends to increase as other market participants also notice the move, which leads to the snowball effect.
How it works
The beauty in the break above/below a simple line is its simplicity. Two things of note however:
1) A break of a line is not confirmed until it has actually taken place on a daily closing basis or a 60-minute closing basis (whatever one’s time frame is for looking at the break). In other words, do not anticipate the breakout but rather react to it. A true breakout will give you plenty of time to buy it once it has taken hold.
2) The more often a resistance/support line gets tested the more powerful the ultimate breakout move tends to be. This statement also implies that a first attempt at a breakout may not be the true move but rather that a good breakout may need several attempts to work up the courage.

Chart pattern checklist
Understand your timeframe. For example, if you are noticing one of these patterns on the daily time frame, then it is to be looked at through a multi-day/week lens and not as an intraday trade or a long-term trade. Be aware of general trend in the sector/group/asset class of the stock or other security you are noticing a pattern in. Generally speaking, the odds favor trading patterns in the direction of the general market or subsector that the stock in question belongs to. Wait for confirmation. Do not take any trades prematurely, i.e. before the chart pattern in question has actually signaled a qualified buy or sell signal. Taking trades in anticipation of a pattern buy or sell signal will over time lead to significantly worse returns, bad habits and ultimately a loss of confidence in one’s strategy. Check your opinions at the door. Over the years I have learned to respect a qualified pattern signal and even if it goes against what I think about where that stock should move to. The market’s move trumps all conviction.
The Case for Active Investing or Swing Trading
No stress, no boredom: Swing trading captures a sweet-spot in the world of trading when it comes to timeframes. Swing trading doesn’t require the trader to be glued to the screens all day, nor is it too hands off. Swing traders can check on the markets a couple of times per day, while maintaining their day job, hobby or whatever else keeps them busy. Comfortable holding timeframes: The typical holding period for a swing trading position is anywhere from two days to four or more weeks. This timeframe allows individuals to follow the news flow and price action without having to worry about the intraday ticks and noise. Un-crowded trades: The holding periods of two days to multiple weeks is too long for day traders and typically too short for institutional investors, hence allowing us to profit from less crowded trades with clean patterns. Plethora of setups: Swing trading yields a steady stream of trading setups every week and month. Defined risk: Every new trade automatically has a clearly defined stop-loss level and profit target. No emotions, just a focus on flawless execution.
Trading is an art, not a science, but a clear trading plan is of essence for success.
My active investing/trading approach and plan I have developed over the years is straightforward to understand and forces me to focus on only executing high probability setups, all the while understanding and closely following the ever-evolving bigger picture. I strongly encourage everyone to structure their trading plan in a similar way, i.e., in that it focuses on execution rather than too complex an analysis plan.
Here are just a few of the vast benefits of diversifying investments/trades across several types of trading setups (and ideally in different timeframes):
Increased consistency of profits Decreased correlation of one’s portfolio vs. the broader market performance Market participant gains significantly better perspective of the market’s current standpoint and opportunities Market participant can act from a more neutral standpoint and will trade without stress Market participant will find more trades with the most favorable risk/reward ratio
Today’s dynamic markets demand flexibility in trading timeframes and adaptability of trading ‘systems.’ The objective is to thereby reach more consistent profits. Active investing and trading does not have to be hectic. Understanding the bigger picture, not fighting trends and having a well- defined and repeatable process is 95% of the key to consistent success.
THE SPECIAL OFFER
Sign up for The Steady Trader Inner Circle for 90 Days Here.
The 3 Month Offer Includes:
Author: Serge Berger, Head Trader and Investment Strategist
Company: The Steady Trader
Website: TheSteadyTrader.com
Services Offered: Trading Education, Trade Alerts, Trading Workshops
Markets Covered: Stocks, Options, Futures
DISCLAIMER
"This eBook is for information purposes only. Any products or services offered or recommended are not endorsed by OptionPub and neither the company nor its affiliates bear responsibility or control over the content of the information and the product or service offered. There is a very high degree of risk involved in trading. Past performance is not indicative of future results. The profits and performance shown are not typical, we make no future earnings claims, and you may lose money. OptionPub and all individuals affiliated with this site assume no responsibility for your trading and investment results. The indicators, strategies, columns, articles and all other features are strictly for communication purposes only and should not be construed as investment advice. Information for any trading observations are obtained from sources believed to be reliable, but we do not warrant its completeness or accuracy, or warrant any results from the use of the information. Your use of the trading observations is entirely at your own risk and it is your sole responsibility to evaluate the accuracy, completeness and usefulness of the information. Your information may be shared with our educational partners. You must assess the risk of any trade with your licensed investment professional and make your own independent decisions regarding any securities or investments mentioned herein. Affiliates of OptionPub may have a position or effect transactions in the securities or investments described herein (or options thereon) and/or otherwise employ trading strategies that may be consistent or inconsistent with the provided strategies."
Peter Schultz, WealthBuilderPublishing.com

A lot of traders talk about getting rich in the markets, but few actually do, and it probably has more to do with what they’re trading than how they’re trading.
Which is why the video you are about to watch is so fascinating. You see, I’ve figured out why the biggest gains in the stock market likely come from companies you’ve never heard of... and how you can try to become wealthy from it.
And the crazy part is it’s not some wild trading scheme that’s hard to follow and even harder to implement--with charts and graphs and indicators going all over the place.
In fact, once you know what to do, it might seem pretty darn simple.
My name is Peter Schultz and I’ve been helping people try to make money in the options market seemingly forever. Options give you so much potential upside for such a tiny amount of money--and they move so dramatically compared to stocks--that stock trading just seemed like a waste of time…
Until I found this one little niche in the stock market that the entire financial media ignores and if you do, it's usually with "dire warnings". But once you know what to look for, you can literally get in the path of some pretty high percentage gains, simply by buying tiny stocks for pennies and then watching them turn into dollars.
No trading, no pouring over charts late into the night, and no watching your computer screen to try and catch the perfect set-up. No, none of that! Just simply buy and hold, but with stocks that have the potential to generate big rewards.
Sound impossible? Well, if you are skeptical that’s great, because I’ve put together a video presentation with some facts and historical trends that I think you are going to find fascinating. The video is only 11 minutes long so it shouldn’t have any problem keeping your attention ... in fact, it could be the most intriguing presentation of your investing career.
SHORT VIDEO PRESENTATION: CREATING WEALTH FROM COMPANIES YOU'VE NEVER HEARD OF
THE SPECIAL OFFER
My Microcap-Investor program includes high-potential picks, detailed commentary, timely email updates, and access to the complete training course.

Author: Peter Schultz, Founder
Company: Wealthbuilder Publishing
Website: WealthBuilderPublishing.com
Services Offered: Trading Courses, Coaching, Weekly Advisory Newsletter
Markets Covered: Stocks, Options
DISCLAIMER
"This eBook is for information purposes only. Any products or services offered or recommended are not endorsed by OptionPub and neither the company nor its affiliates bear responsibility or control over the content of the information and the product or service offered. There is a very high degree of risk involved in trading. Past performance is not indicative of future results. The profits and performance shown are not typical, we make no future earnings claims, and you may lose money. OptionPub and all individuals affiliated with this site assume no responsibility for your trading and investment results. The indicators, strategies, columns, articles and all other features are strictly for communication purposes only and should not be construed as investment advice. Information for any trading observations are obtained from sources believed to be reliable, but we do not warrant its completeness or accuracy, or warrant any results from the use of the information. Your use of the trading observations is entirely at your own risk and it is your sole responsibility to evaluate the accuracy, completeness and usefulness of the information. Your information may be shared with our educational partners. You must assess the risk of any trade with your licensed investment professional and make your own independent decisions regarding any securities or investments mentioned herein. Affiliates of OptionPub may have a position or effect transactions in the securities or investments described herein (or options thereon) and/or otherwise employ trading strategies that may be consistent or inconsistent with the provided strategies."
By Eric Wilkinson, ProTraderStrategies.com
Today, all traders and investors are faced with rising interest rates. Some will turn a blind eye and will watch their portfolios implode … while others will watch this video and will learn how to hedge against the inevitable. As traders and investors, we must be diligent with regard to managing losses and more importantly, be on the lookout for potential pitfalls. This is the environment we are in and the value of our bonds and notes in our portfolios are about to get decimated.
Join Eric "Wolfman" Wilkinson, former Chicago Board of Trade floor trader and 25-year professional trader, as he explains how traders and investors can minimize the severe loss in value of our interest rate sensitive products. Eric will show the correct way to hedge your portfolio in a rising interest rate environment.
SHORT VIDEO PRESENTATION: PROFIT RESOLUTION - HEDGING AGAINST HIGH INTEREST RATES
THE SPECIAL OFFER
Get the Wolfman Options Training Webinar
Here’s what you’ll learn

Author: Eric Wilkinson
Company: Pro Trader Strategies
Website: https://www.protraderstrategies.com
Services Offered: Trading Schools and Trading Strategies
Markets Covered: Futures, Stocks, Forex and Options
DISCLAIMER
"This eBook is for information purposes only. Any products or services offered or recommended are not endorsed by OptionPub and neither the company nor its affiliates bear responsibility or control over the content of the information and the product or service offered. There is a very high degree of risk involved in trading. Past performance is not indicative of future results. The profits and performance shown are not typical, we make no future earnings claims, and you may lose money. OptionPub and all individuals affiliated with this site assume no responsibility for your trading and investment results. The indicators, strategies, columns, articles and all other features are strictly for communication purposes only and should not be construed as investment advice. Information for any trading observations are obtained from sources believed to be reliable, but we do not warrant its completeness or accuracy, or warrant any results from the use of the information. Your use of the trading observations is entirely at your own risk and it is your sole responsibility to evaluate the accuracy, completeness and usefulness of the information. Your information may be shared with our educational partners. You must assess the risk of any trade with your licensed investment professional and make your own independent decisions regarding any securities or investments mentioned herein. Affiliates of OptionPub may have a position or effect transactions in the securities or investments described herein (or options thereon) and/or otherwise employ trading strategies that may be consistent or inconsistent with the provided strategies."
By John Nyaradi, TradingGods.net
Profit Resolutions for the New Year
The New Year is a new beginning in many ways and a great time to set some trading goals and commit to a trading program that can make 2022 your best financial year ever!
Option trading is attractive to many traders because it offers excellent leverage, the opportunities to go long and short within IRA accounts and the ability to maximize your capital and return on investment. But, of course, options trading isn’t easy. If it were easy, everyone would do it and be successful. But that isn’t the case. The fact is that most options traders lose money, and so it only makes sense to do the opposite of what most traders do.
Most traders buy far out of the money puts or calls and hope for a home run, but these are low probability trades that are like gambling or buying a lottery ticket. To be successful you need a prudent and sound trading plan that includes high probability strategies combined with sound risk management.
TradingGods.net is dedicated to helping you succeed as an options trader and this video outlines our best strategies to help you find profit in the New Year.
Strategy #1: Sell Options
Strategy #2: Buy options, but not the way most people do
SHORT VIDEO PRESENTATION: 2 OPTIONS PROFIT RESOLUTIONS FOR THE NEW YEAR
THE SPECIAL OFFER
Good luck in the New Year and sign up to get our free eBook, Selling Options for Income and learn more about our trading strategies and services.
Like anything, options trading is a skill that can be learned, and you can become an expert and tap into the enormous money-making opportunities that options trading provides.

Author: John Nyaradi
Company: TradingGods
Website: TradingGods.net
Services Offered: Trading Education, Alerts
Markets Covered: Stocks, Options, Forex, Day Trading, Swing Trading, Investing
DISCLAIMER
"This eBook is for information purposes only. Any products or services offered or recommended are not endorsed by OptionPub and neither the company nor its affiliates bear responsibility or control over the content of the information and the product or service offered. There is a very high degree of risk involved in trading. Past performance is not indicative of future results. The profits and performance shown are not typical, we make no future earnings claims, and you may lose money. OptionPub and all individuals affiliated with this site assume no responsibility for your trading and investment results. The indicators, strategies, columns, articles and all other features are strictly for communication purposes only and should not be construed as investment advice. Information for any trading observations are obtained from sources believed to be reliable, but we do not warrant its completeness or accuracy, or warrant any results from the use of the information. Your use of the trading observations is entirely at your own risk and it is your sole responsibility to evaluate the accuracy, completeness and usefulness of the information. Your information may be shared with our educational partners. You must assess the risk of any trade with your licensed investment professional and make your own independent decisions regarding any securities or investments mentioned herein. Affiliates of OptionPub may have a position or effect transactions in the securities or investments described herein (or options thereon) and/or otherwise employ trading strategies that may be consistent or inconsistent with the provided strategies."
vince Vora, TradingWins.com
Support and Resistance techniques have become even more important recently in the overall context of technical analysis. As the markets have changed over the course of the pandemic and continue to do so into the new year, so have ways to analyze them from a technical perspective.
Support and Resistance levels provide precious clues in finding higher-probability entries, take-profit levels and, certainly, stop-losses. But how exactly do they work?
In the video, you’ll learn how to find these levels on a chart and focus on the ones that ought to be given more weighting. You’ll also learn different techniques to construct your own support and resistance levels, including Moving Averages, Volume Profile and Anchored Volume Weighted Average Price (AVWAP) points.
I hope you find it useful.
SHORT VIDEO PRESENTATION: TRADING WITH SUPPORT AND RESISTANCE
THE SPECIAL OFFER
Get our Magic of Chart Patterns training program and learn 7 unique charting patterns that you can use to find powerful trades all throughout 2022. These patterns are time-tested and will help you adapt as market conditions change. As a bonus, you'll also get LIVE training 3 times per week with Vince Vora.

Author: Vince Vora, Senior Trader
Company: Trading Wins
Website: TradingWins.com
Services Offered: Trade Alerts, Daily Market Commentary, Nightly Videos
Markets Covered: Stocks, options, Forex, Futures
DISCLAIMER
"This eBook is for information purposes only. Any products or services offered or recommended are not endorsed by OptionPub and neither the company nor its affiliates bear responsibility or control over the content of the information and the product or service offered. There is a very high degree of risk involved in trading. Past performance is not indicative of future results. The profits and performance shown are not typical, we make no future earnings claims, and you may lose money. OptionPub and all individuals affiliated with this site assume no responsibility for your trading and investment results. The indicators, strategies, columns, articles and all other features are strictly for communication purposes only and should not be construed as investment advice. Information for any trading observations are obtained from sources believed to be reliable, but we do not warrant its completeness or accuracy, or warrant any results from the use of the information. Your use of the trading observations is entirely at your own risk and it is your sole responsibility to evaluate the accuracy, completeness and usefulness of the information. Your information may be shared with our educational partners. You must assess the risk of any trade with your licensed investment professional and make your own independent decisions regarding any securities or investments mentioned herein. Affiliates of OptionPub may have a position or effect transactions in the securities or investments described herein (or options thereon) and/or otherwise employ trading strategies that may be consistent or inconsistent with the provided strategies."

I didn’t learn this method from some online “guru” or anything like that.
My mentor was an investment banker.
And in the 1970s I saw him turn $500,000 into $5 million (the equivalent of $35 million today if adjusted for inflation!).
The profits and performance shown are not typical, we make no future earnings claims, and you may lose money.
Today, this stuff is second nature to me.
And now I want to share it with you.
By Troy Noonan, BackPackTrader.Com
Back in the late 90’s, during the ‘ramping up’ of the Dot- com Boom, I had the great opportunity of backpacking through Western Europe right when the revolutionary new proliferation of internet café’s began cropping up all over the place. I would land in a particular city and before even checking into my lodgings, I would be logging into my online trading account to manage my trades. I had been trading for several years with a lot of ups and downs, successes, and failures. I had already lived through the best trade of my life and the worst trade of my life, though at the time I hadn’t fully realized that yet nor had I even given it any thought.
All I knew at the time was that I was loving this newfound level of freedom. Being able to come and go, stay put, leave, turn left when 5 minutes earlier I had planned on turning right, etc. Nothing felt more empowering than being able to log into my account with a nice strong freshly brewed cup of coffee in some strange place I had never been to before. Best of all was the feeling I had from watching the balance of my account continue to grow with each passing day and each new exotic location.
What I did not know at the time however, apart from the freedom I was experiencing, was that during that historic time in the markets, anyone who could have fogged a mirror would have been able to grow their trading account.
That fact was lost on me at the time until a year or so later when the Dot-com Boom had become the Dot-com Bust, which I actually survived, by the way. Many did not, however. Thus, the word Bust! It was clear to me that I had MUCH to learn.
Successful Trading = Absolute Freedom It would be a few years before I would discover many of the ingredients required for consistent trading success. There were a number of pivotal steppingstones, each one progressing to the next that set me on the proper path and basically changed my life.
“Success Trading = Absolute Freedom”
From over 13 years of calling a successful live trade room, to creating a number of highly effective, top selling trading strategies, training regiments, countless winning trade plans, webinars, live group training sessions, one on one mentoring, large in person presentations and training
sessions, more trades than I could count, as well as becoming a trading coach and helping countless traders over the years, I can say that the same themes continue to emerge; themes that indicate why a trader is struggling or how and why they are succeeding.
“All my strategies were created with the intention of solving these issues”
All my strategies were created with the intention of solving these issues, in their approach, their training, and their overall trading philosophy. It’s no coincidence that my latest and most effective trading strategy to date (at the time of this publication) is called the Spotlight Power Trader. The word ‘Power’ is to signify that these 12 Powers to Successful Trading are built right into the very DNA of the strategy itself.
The Spotlight shines a light on winning trade setups that have a very high percentage predictive outcome and that continually repeat themselves all the time on all the best trading markets and charts.
We then combine that with the 12 Powers to Successful Trading, as described in this report, the net result being, the Spotlight Power Trader.
All of these 12 powers are things we have POWER over and can control as traders. By learning how to focus and control each one in a coordinated effort, we can stack the odds in our favor (power of the numbers) and be in the absolute best position for ongoing success as traders.
It is necessary though to NOT just shake your head yes because you intellectually understand the good sense that is being described, and then move on, forgetting to actually implement the power in your trading. Work these powers into your everyday routine. You have to DO it!
Actions speak louder than words and to really enact change for yourself, you have to take ownership of the power and then remain vigilant and judge yourself by the things you actually do, not what you say and think. That will separate the winners from those who think they want it, but really don’t.
It all flows down from the first power. The strategy is designed to apply each of the subsequent powers to the benefit of the first and most important power, WHY we are trading in the first place. To make money!
For that reason, our overall strategy goal is “to be able to quit with a positive result, a vast majority of the time, while controlling our drawdowns with minimal and efficient trading as defined in our trade plans.” It takes all 12 powers working in concert to be able to accomplish this overriding goal on a consistent basis. The rewards though are astronomical and life changing, the theme of which is what our blog, BackpackTrader.com is all about.
The Power of Why
This is where it all begins and is THE most important power. If you don’t really know WHY you are trading, you are doomed to get results you never intended, probably leading to failure.
The markets will give you what you are asking for which will be a net result of everything that you DO or don’t do as a trader. Most people do not actually know WHY they are trading. They think they do but then their own actions suggest something completely different.

The only reason to trade is ‘to make money.’ That’s it! Until you take ownership of that reason, you will end up repeating the things that lead to losses and failure. You will get the results caused by trading for wrong reasons. Own it! Commit to your reason for trading and then DO the things that reflect that and nothing else.
If you truly understand WHY you are trading and are ready to commit to owning it, then the next logical question to ask is HOW? How do you achieve your reason for trading?
The answer is in the remaining powers beginning with the next one.
The Power of the Trade Plan
The Trade Plan PROVES you can make money. The only real way you can make money as a trader is by the proven statistical advantage, the EDGE, that your trade plan gives you.
We can prove our trade plans before we ever risk our capital. Successful, proven trade plans are what achieves our WHY, because it gives us a way to grow our equity in our trading accounts. I often refer to this work as ‘preproduction’ and it is essential you get it right.
Making money is WHY we trade. Proven trade plans is HOW we achieve our WHY, using the other 10 powers that follow.
The Power of Foundation
One of the earliest components an aspiring successful trader should focus on building is a strong ‘trader foundation.’ As a concept, this should be pretty obvious. Try building a house for example on a flimsy foundation and you can imagine the disaster that would soon ensue.
Trading is a business and like a house, a business must also be built on a strong foundation. Trading though is very unique because there are many ‘human’ aspects involved that we have to learn how to solve, if we are to become successful traders. As you will learn throughout this eBook, humans are not wired to make good traders. Successful trading is something that must be learned.
Technique is the easy part of the learning process. That’s just a matter of repetition. What’s harder is learning how to master oneself. There is a process that one can and should follow and this section is meant to help you understand what is required for a strong foundation that you can grow your trading business on.
In short, when I speak of ‘strong trader foundation,’ I am speaking of your belief in what you are doing. If you do not believe in what you are doing as a trader, the human elements that are destructive to trading will emerge and cause you to do everything that will lead to losses.
I often receive questions about certain trade plans, strategies, setups, etc. that imply a lack of belief. The questions are often hidden in terms that are seeking absolute answers.
Indirect questions that amount to “will this be a winning trade?” The proper answer is ‘no one knows!’ Nor should it matter. The results of the trade plan is what makes you money, not the result of a trade. Because as traders, we have to take another trade, right? We can’t be worried about the outcome of a trade or series of trades.
We have to instead, run our trading business based on rules (Power of Mechanical Rules) and the statistical advantage our trade plan gives us (Power of the trade plan, Power of Numbers, Power of the CEO).
One must go through a series of steps to build the necessary belief so that you have the confidence required to ‘take the next trade,” as described in the rules of your proven trade plan; proven being the operative word here. You can’t just talk yourself into believing. That can never work. Your human instincts are too powerful. You need to train yourself by ‘recalibrating your internals,’ so you can transform from a person trying to trade into an actual trader.
You have to have had lived through the good, the bad, the ugly, the great, over and over, and also witness the equity curve rising, despite the moments of ugly. This helps you rise above to the higher level of understanding that traders must ascend to to achieve consistent success. You will never be able to believe in what you are doing if you don’t build a strong trader foundation. And if you can’t believe in what you are doing, it will show and manifest in your actions -- actions that will not get you the desired result -- the accomplishing of your WHY for trading. The good news is that there are very tangible steps one could follow to build a strong trader foundation correctly and thoroughly.
The Power of Quitting
The Power of Quitting is one of the most elusive, hard to understand powers yet it is critical to one’s success. Inexperienced traders think the more you trade, the more money you make. The Power of Quitting says the more you KEEP, the more money you make.
There is nothing more aggravating than banking some nice profits only to keep trading and give the money back to the markets. You would have been far better off just stopping and hanging onto your hard-earned gains.
The Power of Quitting (PoQ) empowers you to do just that. We build it into the rules of our trade plans. It is a ‘dynamic’ self-adjusting goal setting strategy that allows us to mitigate our risk exposure to the market and to keep our profits in our accounts.
The best PoQ rules will “allow you to take what the market wants to give (not what YOU want from the market) while allowing you to quit with a positive result a majority of the time.”
The great irony is that by taking what the market wants to give you, over time as you build your position size, the markets WILL give you what you want. We use the next power to achieve this as we continue to grow our accounts.
The example on the right is a classic Spotlight Power Trader trade. The green bars mean stay long. The entire trade prints right on the chart. The plan is clearly displayed in the data window on the right side. There is no guess work. We know exactly what to do from start to finish.
This recent long trade in crude oil futures was the first trade of one of our Spotlight Power Trader trade plans. It triggered in at the yellow plus sign, the 3rd and 4th dots above being our profit objective for this trade.
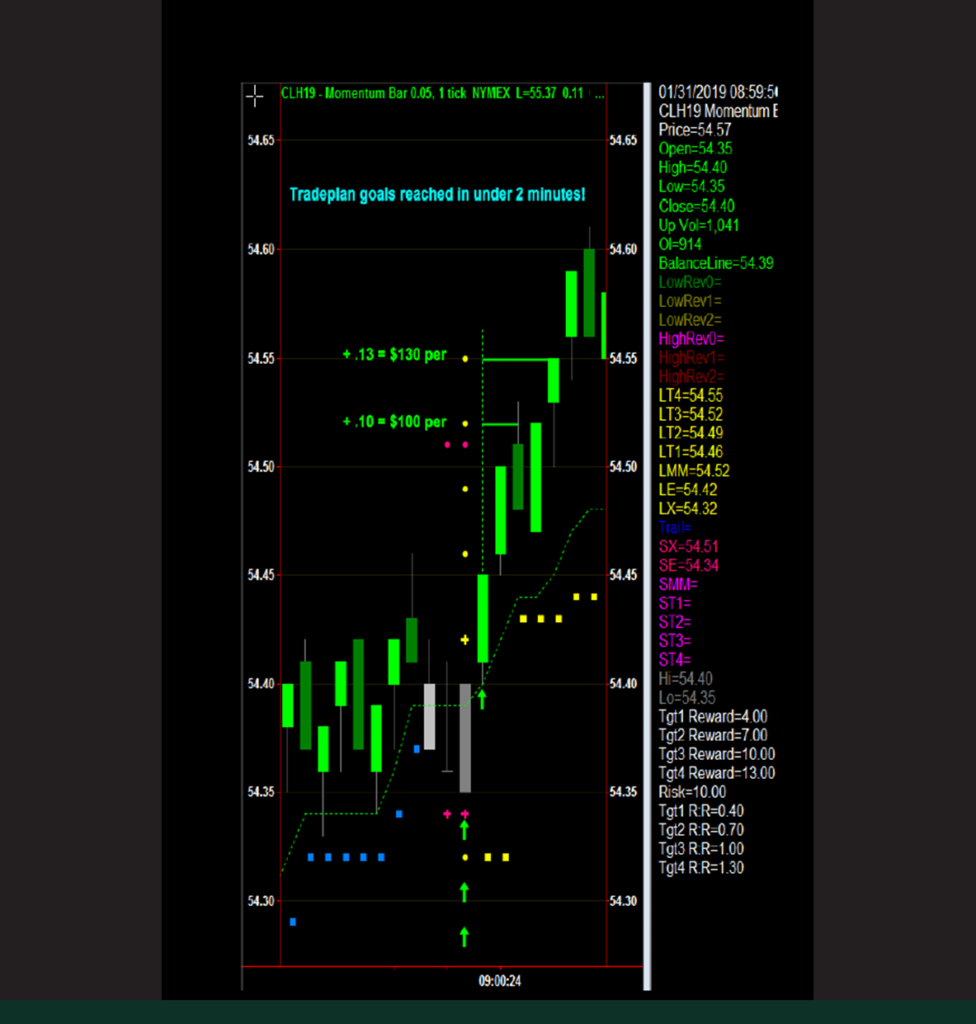
The trade triggered in and hit its targets in less than 2 minutes. Imagine the very same trade once the trading account has grown to be able to support 10 contracts.
There is no need to continue trading with this trade plan once the goals are reached, in this case, 2 minutes into our session. This trade might not look like much, but it has all 12 powers built into it and it continues to win, and reach new equity highs on a consistent basis, thus, achieving our reason for trading.
The Power of Compounding
There’s a reason Albert Einstein refers to the power of compounding as the 8th wonder of the world. This is truly the path to riches. We use this concept to help guide us along the path of least resistance. Realizing that wins and losses come at a random distribution, we need to control our risk in the market. The Power of Quitting, the Power of the Trade Plan, some of the other powers in this report help us do that. The Power of Compounding though is how we leverage our success into the realization of our financial goals -- and dreams, for that matter.
The way to succeed and reach our financial goals requires trading LESS, not more. We control our risk with smart money management. One should only risk about 2% of their trade capital on any given trade, and only trades within the context of their proven trade plan. As your account grows, you can give yourself a raise by moving your finger from the one to the two. You add to your position, in other words, keeping to the 2% risk:capital ratio. The 2% can be a little more for more aggressive traders, and a little less for more conservative traders. Much depends on the effectiveness of your trade plan, too. If you’re winning at a large rate, perhaps risking a little more is appropriate. The point is, keep your risk small as a ratio to your trading capital so you can survive the random distribution of wins and losses. This is essential. The Power of Compounding works like a ramp, that inclines faster and faster as your account gets larger and larger. In other words, the rate of growth increases exponentially.

Successful trading is purely a numbers game. It’s ALL about the numbers. We can’t control the random distribution of wins and losses, but we CAN control what we do with that distribution. Ultimately, we have to let the superior odds of our trading strategy and trade plan do the heavy lifting for us. Winning more, losing less, proper risk management and money management, along with proper and accurate execution is what it takes to succeed.
A good money-making approach, using the powers in this report, should produce a ‘2 steps forward, 1 step back, 2 steps forward, 1 step back’ journey to success, or better. It’s all about staying focused on the big picture and executing the proven trade plan so that the odds can work to grow your equity and get you to your financial goals. Combine that with the Power of Compounding (all the powers) and even just one trade per day can get you to your goals.
Humans make terrible trades because we live in the moment and have a hard time elevating to the necessary higher point of view required for success. We want to avoid pain. The typical ‘human’ thing to do when trying to trade is to wait until witnessing the ‘markets trading well, and the winning trades happening.’ Ironically, the ‘person trying to trade’ will jump in, right at the end of the 2 steps forward.
As the ‘1 step back’ begins, all the unpleasant feelings one experiences from losses begin to mount. Then, right at the end of the 1 step back process, the typical ‘human trying to trade’ will quit with their losses, right before the ‘2 steps forward’ is about to begin, which would eliminate their losses and actually grow their equity to higher levels. Too late!
That person has already headed for the exit, feeling beaten up and cheated, looking for the ‘next great strategy’ to begin the same destructive routine all over again until they have blown up their account and begun their new job working at IN and Out Burger; a noble pursuit but perhaps not their first choice in career paths. They threw the baby out with the bathwater; a perfectly good and profitable trading approach, merely because they didn’t understand the Power of the Numbers and the 2 steps forward, 1 step pathway to financial freedom.
We call that ‘Chasing Performance’ and it’s a sure path to financial ruin. Check yourself and make sure that you too, are not falling into this trap.
Here is a real-world example to help you better understand how the Power of Numbers work, in concert with the other powers. This example is from a trade plan from one of my earlier strategies, the Trend Jumper. Perhaps you’ve heard of it? I called the trades from this trade plan live in our trade room back in 2012 thru 2014, give or take. This plan still works!
The first graphic below shows the hypothetical parameters of a trader who only has $2000 to trade with. Due to her small account, it was decided that the best approach would be to day trade an effective forex plan because of the ability to employ micro lots, keeping the risk finely tuned to a safe ratio of risk to capital.
This plan utilized a scaling in and scaling out concept and as a result, it uses a 3% net position size (3% of one’s capital). And, as you look at this example, notice the two columns on the right. The Column under SINGLE illustrates how a $2000 account would have grown to over $2500 in about 15 months. The position size remained the same throughout the 15 months. No money management was used. That’s an excellent return, for sure, on a percentage basis. Remember this trader only started with a $2000 account. A Wall Street career requires about 10% per year growth but this tradeplan’s growth reflects much more than that. This is just trading 1 micro lot, 10 cents/pip, per trade, to put things in perspective.
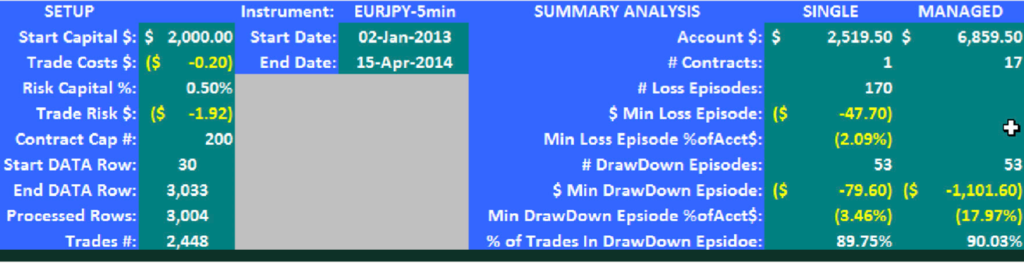
The Power of Structure
What you see on your chart makes all the difference. The power of structure is all about setting up your charts in a way that leads to flawless trade execution and understanding. Each trade one takes should be fully planned from start to finish, along with rules in how to manage the trade once it is live. We set up our strategies so that the entire trade prints right on the chart; entry, stop and targets, all clearly indicated. No guesswork. We’ve all heard the words of wisdom, ‘plan your trade, trade your plan.’ This is part of trade planning, but structure is how we see the trade presented on the chart so that we can act upon it.
Notice on this chart, we can see exactly where the entry is, the stop, the targets and even how and when we moveour stop to reduce or eliminate risk as the trade progresses. There is never any guess work. We can even see the important details of the trade in the side data window.
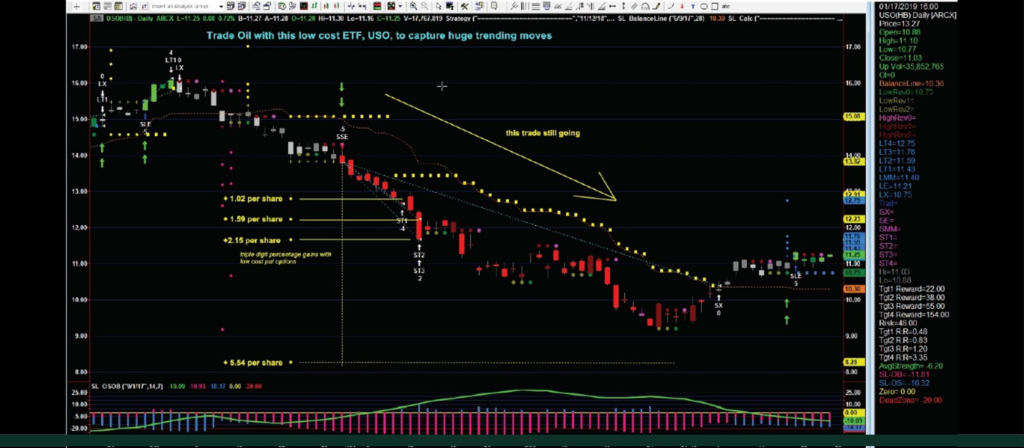
The Power of Dynamic Setups
Markets are not static. They are ever changing, uncontrollable beasts that have a mind of their own; a collective mind of all the participants. As a result they can not be controlled. This is not a good thing or a bad thing, it just is. Because of the every changing conditions of the market, we need to be able to go with the flow. I like to say that we need to be a willing dance partner, always letting the market take the lead. Whether we like it or not, the market IS going to lead.
That’s what makes this power so essential for ongoing success. The Power of Dynamic Setups means that our trade setups can adjust to market conditions. They can tune themselves, dance with the market, to give us the best chance of succeeding with a particular trade.
My earlier strategies (Seven Summits Trader, Trend Jumper, Counter Punch Trader, etc) all work just as good today as they did when they first were created, because they ALL use the Power of Dynamic Setups. They all can dance with the market and present trades that are the most appropriate for that exact moment on the chart. That doesn’t mean every trade will win. If we have done our homework though and the trade fits into the context of our winning trade plan, then the odds will be stacked firmly on our side, which is all we can ever hope for as traders.
Notice in the example below how the trades shown have different sizes. Each one has been self-adjusted, tuned to the conditions of the market at the moment the setup appears. We take what the market wants to give us.
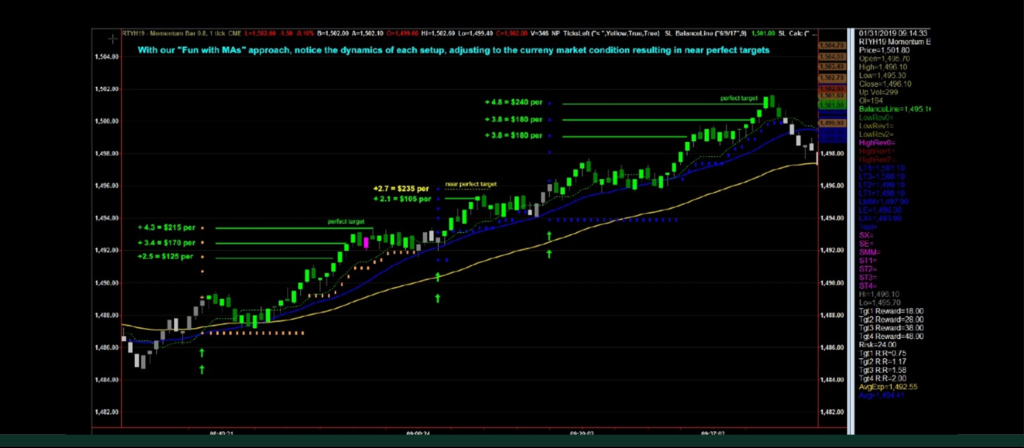
The Power of Surrender
You ever wonder why real smart people often make terrible traders? It’s all about surrender. Some people are just too smart to realize that their smarts are not helping them as traders. They cannot relinquish control and they struggle trying to control that which cannot be controlled. The market! For being so smart, that’s not so smart, is it? Most people are their own worst problems and their own worst impediment to success. Why?
This power often causes one to scratch their head and say ‘huh?’ but it is one of the most important powers. Without this, most people find it impossible to take ownership of the rest of the powers. Start from the first power, the Power of Why.
Why are we trading? Most people think they know, but then their actions suggest otherwise. This is the root of everything that destroys a trader and the only way to solve it is through the Power of Surrender. If we can put our egos aside, we can begin to judge ourselves by our own actions. Your actions as a trader will tell you what issues you need to work on to move you closer to success. It’s your number one indicator.
Humans have strong egos. We want to control everything. We want to prove how ‘smart’ we are. We may not even understand this about ourselves, but it always shows in one’s actions. There is no hiding from it and it is easy for anyone to see. It requires humility and the ability to have an honest heart to heart with the person in the mirror.
Commit to WHY you are trading (The Power of Why) and then set out to accomplish your WHY. It does not involve proving how smart you are, avoiding losing trades or any of the other intuitive stuff humans do. If you are doing those things it’s because you are not trading to make money. You are trading for another reason that you probably don’t even understand about yourself.
Those types of behaviors come from a different motivation and indicates that you have not taken ownership of the first power. Most people trying to trade don’t even realize these trappings are occurring or why, or how to fix them even if by chance they are aware of them. Failure is unavoidable until this is solved.
“To be a successful trader, you need to transfer yourself and actually become a trader”
It all comes from the need to survive. That’s why humans typically make terrible traders. Losing trades are painful and pain represents extinction. It causes us to do things that attempt to stop the pain. Successful trading though is counter intuitive.
To be successful as a trader, one needs to transform him/herself and actually become a trader. A person needs to go through the process of ‘recalibrating their internals,’ and do the things to transform into a trader. (The No Brainer Guide to Trading Success, focuses on this.) Losing trades exist inside of winning trade plans. You cannot divorce losing trades from winning trades. That’s what humans try to do. It is not what successful traders do.
The Power of Surrender teaches us to relinquish what we cannot control and instead, focus on what we CAN and NEED to control in order to achieve our financial goals; our reason for trading. It’s all about humility and accepting the fact that at the right edge of the chart, we cannot control what the market will do next. The GOOD news is that we can control what trades we take, how we manage them, how we stack the odds in our favor, our position size, and all the other ‘powers ‘in this report that lead us to success.
The Power of Mechanical Setups
If you think of everything you’ve learned so far, one permeating theme that runs through these 12 Powers is the need to remove the ‘human element’ from trading. Making objective decisions is ultimately what we must do to succeed. That’s easier said than done without taking full ownership of the other powers, but it can and must be done.
This is where the Power of the trade plan, as well as the Power of Why, the Power of Structure and the Power of the CEO come into play. But it begins with the Power of the Trade Plan. When we have a trade plan with a clear set of rules, we can test it and prove that it gives us an EDGE that will make us money. Once we have tested and achieved ‘measurable results,’ we can use that to build our Foundation of Belief
(Power of Foundation) and create a set of mechanical rules to follow. We can use that to confirm our trade plan. If we have rules to follow that we have built enough belief in, then all we have to do is ‘lean on the strategy and rules of our proven trade plan,’ and take the next trade as the rules dictate. We can remove the human element and remain objective. It’s an amazing experience when you take the pressure off of yourself as a trader and just ‘lean on the system.’
Moreover, we can practice executing the plan physically, so that we learn to master our trading platform, eliminate execution errors, and perfect our ability to flawlessly placeour trades. This is obviously a critical component to ongoing success as a trader. Mechanical rules will help us eliminate costly mistakes.
A simple set of rules that could and should be tested would be:
These are rules that can be tested, proven and then made mechanical so that you don’t have to think at the right edge of the chart, where trade decisions are made. The next trade in the trade plan shows up, you pull the trigger and take the trade, objectively and without ‘human’ intervention.
There are also subjective decisions that can and will emerge at times. Things like trade maneuvers we often refer to as ‘key level adjustments,’ for example. Wouldn’t it be better to get long a trade a few ticks above a major resistance level than a couple ticks below? We can ask for additional price action confirmation in other words, to give us a little more proof that the price is ready to move through the barrier, or not.
We can make these decisions subjectively (I often refer to them as the 5% art to trading, type of decisions) or, we can create mechanical rules to follow that guide us through these types of decisions and actually work at reducing the 5% art to trading to just 1 or 2%. The Power of Mechanical Rules gives us something to lean on and depend on so that we can remain traders and eliminate the risk of falling into the trappings of being a human trying to trade, what trades we take, how we manage them, how we stack the odds in our favor, our position size, and all the other ‘powers’ in this report that lead us to success.
Power of Lifestyle
There is only ONE reason for trading and that is to make money. Losing traders fail to recognize this critical first step. This power however, the Power of Lifestyle, reminds us why it is we want to make money in the first place. In the end, it’s all about lifestyle. It’s all about having the lifestyle we have always wanted -- the lifestyle we know we deserve, if only we can find a way to achieve it.
It never ceases to amaze me how complicated people make things that are really just best kept simple. There is no reason to overcomplicate one’s trading yet that’s what the majority of people do. If you are strong with your reason for trading, it helps you remain on point with what is actually required to accomplish it. That’s what the power of lifestyle is all about.
Our motto is the “Get in, Get out and Get done!” There is no better feeling than starting your trading session and hitting your goals with the very first trade.
People often ask me what I do and when I tell them I trade in the markets, one of two things typically happens. Either their eyes glaze over, in which case I quickly change the subject or, they say something like “I would love to do that too, but I can’t stand the idea of sitting in front of my computer all day long watching price bars go up and down.”
I get a kick out of the 2nd comment because little do they know that I too, could never do that either. The thought of being glued to my computer all day long is horrifying to me. If the conversation continues, and they ask me how long I am planted in front of my monitors day to day, I merely tell them that today I hit my goals inside of 3 minutes! My biggest problem was figuring out how I wanted to use my free time for the rest of the day!
That same trade two years from now, with a position 20 times larger (power of compounding), still will only take 3 minutes! Of course not all tradeplans hit their goals within 3 minutes every day, but they often do and even if it takes longer sometimes, it’s still about ‘getting in, getting out, and getting done,’ as efficiently and effectively as possible so we can turn our attention on the most important things in life; that which brings us enjoyment and happiness.
We don’t have to work harder to make more money. We work smarter. Less is more! The Power of Lifestyle reminds us of that each and every day.
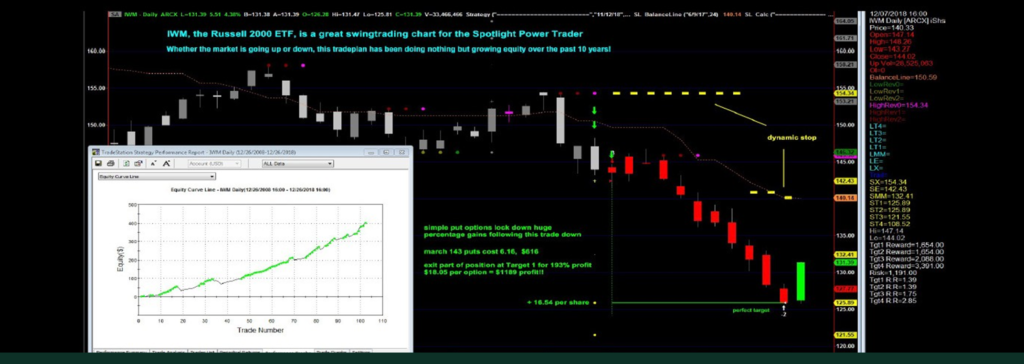
The Power of the CEO
When I am working with a trader, one of the first messages I try to convey to them is that they need to stop being ‘that person trying to trade,’ and instead, ‘be a trader.’ This is usually a head scratcher at first and it often requires a person to go through a series of steps to learn what this actually means.
Trading is a business. Your trading should be your business. All businesses have expenses. All businesses have slow days and busy days. The local dry cleaner down the street might have had very few customers this past Tuesday. She still needs to pay her bills and in fact, she may have even lost money that day. Then Thursday and Friday, all the business comes pouring in and she is able to feed her family and support her lifestyle as a result of her business.
On Wednesday, she heard a customer arguing with her employee working the counter. She had a standard operating procedure in place and her worker new how to handle the irate customer. The owner didn’t intervene, didn’t fret or worry about the outcome. This was just par for the course, another transaction in a series of countless transactions, the sum of which added up to a nice profit -- her reason for being in business in the first place. Do you see my point?
Trades will win and trades will lose. Each trade is nothing more than a business transaction. Some days won’t make any money. What’s important is that the net result of your trading business does make money. From this day forward, I suggest you commit to cease being ‘that person trying to trade,’ and instead, transform yourself into the ‘CEO of your trading business.’ by doing so you will equip yourself with the proper mindset that is required to succeed.
Keeping your attention on the big picture is required for consistent success. It’s a simple concept
when you are the CEO. The power of the CEO is what keeps your business running smoothly, regardless of the bumpy road that we all must travel as traders.
THE SPECIAL OFFER
Get the Counter Punch XPPRESS2 System Here!

Author: Troy Noonan
Company: Backpack Trader
Website: BackPackTrader.com
Services Offered: Trading Education, Alerts
Markets Covered: Stocks, Options, Forex, Day Trading, Swing Trading, Investing
DISCLAIMER
"This eBook is for information purposes only. Any products or services offered or recommended are not endorsed by OptionPub and neither the company nor its affiliates bear responsibility or control over the content of the information and the product or service offered. There is a very high degree of risk involved in trading. Past performance is not indicative of future results. The profits and performance shown are not typical, we make no future earnings claims, and you may lose money. OptionPub and all individuals affiliated with this site assume no responsibility for your trading and investment results. The indicators, strategies, columns, articles and all other features are strictly for communication purposes only and should not be construed as investment advice. Information for any trading observations are obtained from sources believed to be reliable, but we do not warrant its completeness or accuracy, or warrant any results from the use of the information. Your use of the trading observations is entirely at your own risk and it is your sole responsibility to evaluate the accuracy, completeness and usefulness of the information. Your information may be shared with our educational partners. You must assess the risk of any trade with your licensed investment professional and make your own independent decisions regarding any securities or investments mentioned herein. Affiliates of OptionPub may have a position or effect transactions in the securities or investments described herein (or options thereon) and/or otherwise employ trading strategies that may be consistent or inconsistent with the provided strategies."
By Matt Buckley, TopGunOptions.com
Former Navy fighter pilot and Wall Street superstar Matthew 'Whiz' Buckley covers 'Trading the Death Star', completely destroying the Wall Street myth that investors MUST diversify.
In this brief he covers the ONE stock he believes that investors MUST trade, while ditching everything else. A wise investor once said "Diversification is for those that don't know what they're doing'.
The Death Star?
Amazon (AMZN)
There are many advantages to focusing on trading in one solid name like AMZN:
• You trade the same name and potentially profit no matter what direction AMZN moves – up, down, or sideways
• You stay focused on the news that impacts AMZN instead of many different stocks or ETFs
• You become an ‘expert’ in the name, reducing time spent on other positions
• And many other benefits
SHORT VIDEO PRESENTATION: TACTICS FOR THE NEW YEAR - TRADING THE DEATH STAR
THE SPECIAL OFFER
Solo AMZN Monthly Membership
Learn how to fully use my trading strategy using just one stock - AMZN.

Author: Matthew “Whiz” Buckley, Founder
Company: Top Gun Options
Website: TopGunOptions.com
Services Offered: Trading Courses, Mentorship, Trade Alerts
Markets Covered: Stocks, Options
DISCLAIMER
"This eBook is for information purposes only. Any products or services offered or recommended are not endorsed by OptionPub and neither the company nor its affiliates bear responsibility or control over the content of the information and the product or service offered. There is a very high degree of risk involved in trading. Past performance is not indicative of future results. The profits and performance shown are not typical, we make no future earnings claims, and you may lose money. OptionPub and all individuals affiliated with this site assume no responsibility for your trading and investment results. The indicators, strategies, columns, articles and all other features are strictly for communication purposes only and should not be construed as investment advice. Information for any trading observations are obtained from sources believed to be reliable, but we do not warrant its completeness or accuracy, or warrant any results from the use of the information. Your use of the trading observations is entirely at your own risk and it is your sole responsibility to evaluate the accuracy, completeness and usefulness of the information. Your information may be shared with our educational partners. You must assess the risk of any trade with your licensed investment professional and make your own independent decisions regarding any securities or investments mentioned herein. Affiliates of OptionPub may have a position or effect transactions in the securities or investments described herein (or options thereon) and/or otherwise employ trading strategies that may be consistent or inconsistent with the provided strategies."
By Hima Reddy, HimaReddy.com
When it comes to trading, one of the best ways to achieve consistency is to know exactly when and how to capitalize on momentum in the marketplace. In this article, I’m going to show you how to amplify the power of a commonly used, but often overlooked momentum indicator.
Chances are, when it comes to using indicators, you're probably doing it wrong. I’m going to draw from my 21+ years of experience as a technical analyst and walk you through the best way to set up and use your indicators. You will learn to dump the default parameters on one of the most commonly used indicators, and fine-tune it to capture momentum on any market, and on any time frame.
First things first. I need to make sure you understand what momentum IS before I teach you how to optimize it. So, let’s start with a simple illustration of how price and momentum work together.
Let’s head to a racetrack and put ourselves in the driver’s seat. You’re at the starting line of the track, you rev up your engine and you go!
You pick up speed really quickly (or accelerate) on the straight runs. You see a turn coming up, and you prepare accordingly.
You ease off the gas to slow down (or decelerate), even if it’s just a little bit, so that you can have more control as the car whips to the other side of the turn.

Then, after you make the turn and the road straightens out again, you hit the accelerator once more.
Do you get the idea of how you’d accelerate and decelerate on this track? Well now you know exactly how price momentum works!
Now let’s jump into the helicopter that was looking down at the racetrack and get a birds’ eye view of it.
The racetrack becomes price as you see it on your stock charts. And momentum (whether as an index or an oscillator) is generally plotted on the bottom as a sub chart.
When price is trending higher, you’ve got upward momentum that’s improving.
That upward momentum generally begins to slow down and peak before price does, making momentum a leading indicator.
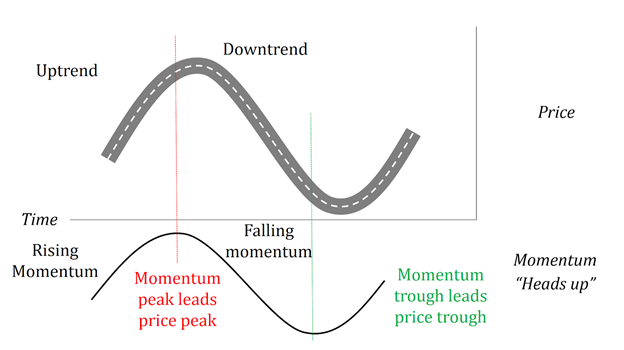
During a trend of decreasing prices, there’s falling momentum that is becoming more and more powerful.
But when a price bottom is approaching, you usually see momentum bottom first.
Therefore, momentum indicators can warn you about hidden strength or weakness, giving you a “heads up” especially when it comes to potential market turns.
Now I’m going to use the game of football (American version) to explain how you’re looking at momentum all wrong AND how to fix that! And let’s specifically use my favorite team, the Green Bay Packers, along with their long-time rivals, the Chicago Bears.
So when they’re playing on this field, Packers and Bears start on opposite sides of one of these yard lines. It could be the 40 yard line on the left half, or the 30 yard line on the right half. All depends on where the last play ended.
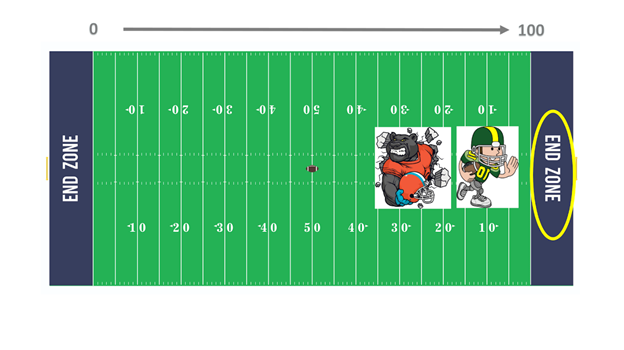
To score any points, each team has to work its way to the opposite side of the field. The Packers have one zone, called the end zone, that they’re eyeing.
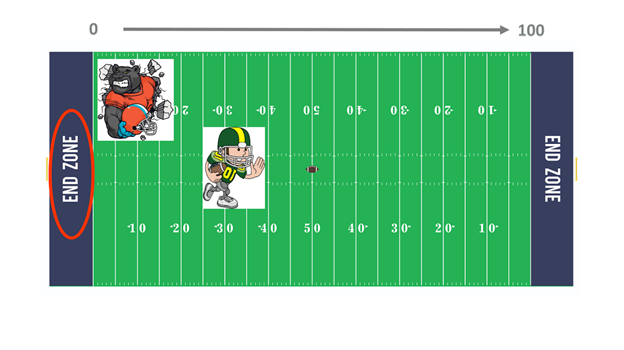
While the bears have their sights set on the other end zone. This means that you generally don’t score points in the middle of the field, you’ve got to get to your zone.
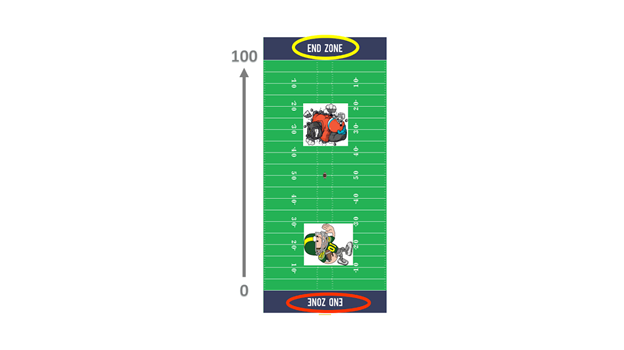
Now let’s flip this football field on its side, and shrink it down, with the same 0 to 100 boundaries.
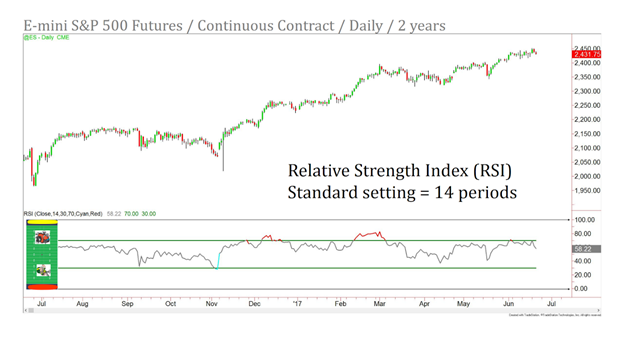
Put it on a price chart, and voila! You see the price of the E-mini S&P 500 futures market, the market that is my “baby”, lined up against the Relative Strength Index, a very popular momentum oscillator. The RSI shows the measure of the relative internal strength of a security against itself. It was built by Welles Wilder, and introduced in 1978, using a 14-day time span.
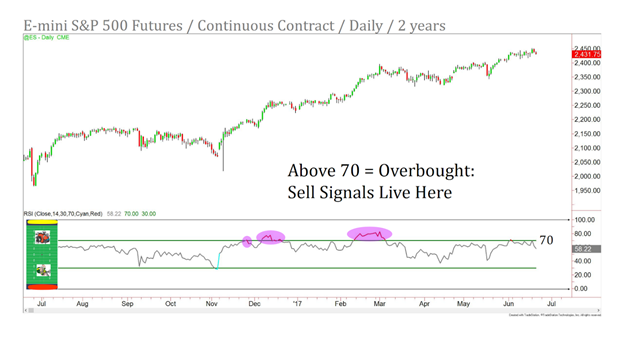
RSI is considered overbought, or ready to sell, when it moves above 70 on its scale of 0 to 100.
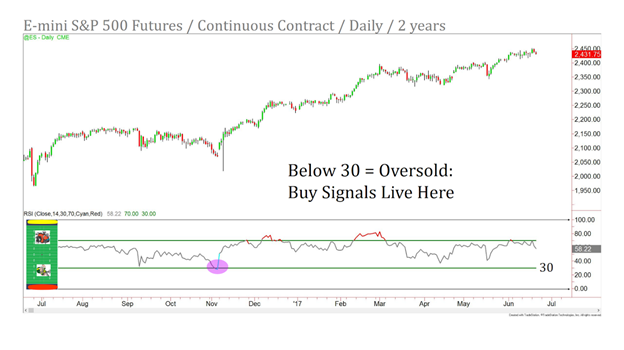
It’s considered oversold, or ready for a buy setup, when it falls below 30.
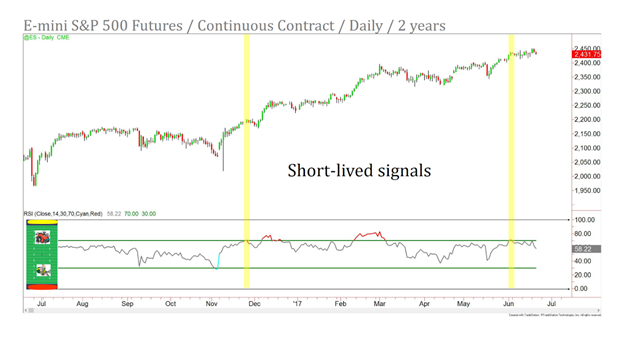
The issue I’ve noticed with many of the sell from above 70 or buy from below 30 signals is that they can be short-lived, especially when the market is in a strong uptrend. See in the ES daily chart above - the overbought sell signal appeared, but the market only corrected lower for a few days before pushing back higher.
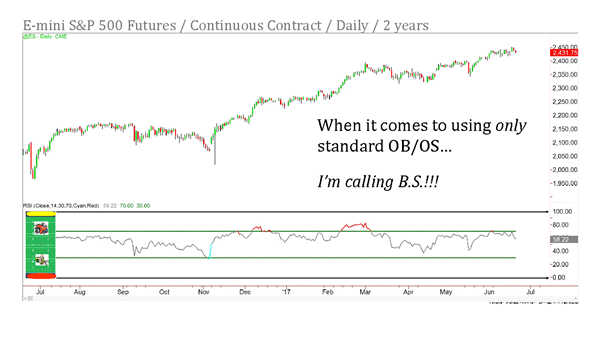
But when it comes to using only the standard OB/OS, there's so much more to it and I’m going to show you how that works.
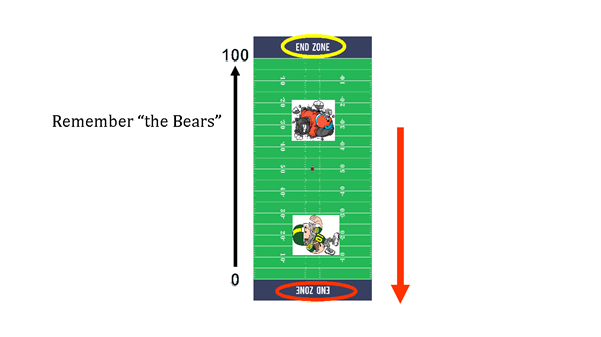
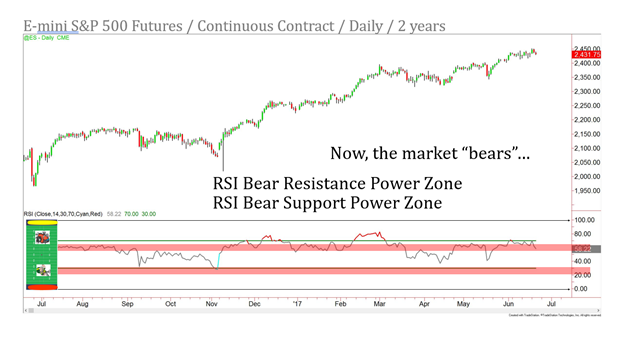
Jumping to financial markets, the market bears can push the market to much deeper oversold levels than in normal market conditions, or in sideways market conditions. And, the actual resistance that they come up to is lower than the traditional 70 level.
Down trending or bear markets generally find resistance when the RSI is in the Bear Resistance Power Zone. And they generally find support when the RSI is in the Bear Support Power Zone.
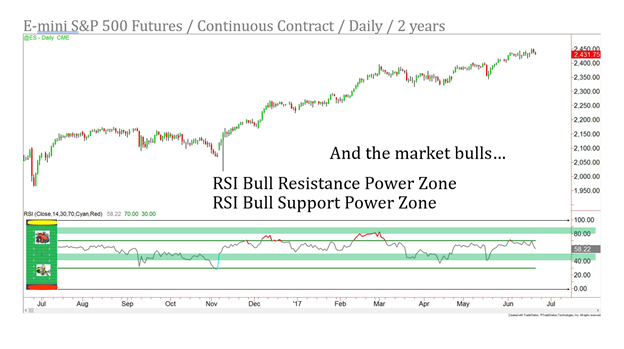
On the flipside, the market bulls generally extend into the Bull Resistance Power Zone. And, in a bull market the RSI doesn’t need to deteriorate all the way down to 30 to see a buy signal. Instead, bull markets generally stabilize ahead of the Bull Support Power Support Zone.
I have adapted my RSI Power Zones indicator to plot these zones, and I’m happy to share those exact settings with you, and share examples of the RSI Power Zones at work!
THE SPECIAL OFFER
To get the exact RSI Power Zones Indicator Settings and make the most of the RSI Power Zones, click the button below for your copy of my complete eBook!

Author: Hima Reddy
Company: Hima Reddy
Website: HimaReddy.com
Services Offered: Trading Education, Futures, Stock and Options Alerts
Markets Covered: Futures, Stocks and Options
DISCLAIMER
"This eBook is for information purposes only. Any products or services offered or recommended are not endorsed by OptionPub and neither the company nor its affiliates bear responsibility or control over the content of the information and the product or service offered. There is a very high degree of risk involved in trading. Past performance is not indicative of future results. The profits and performance shown are not typical, we make no future earnings claims, and you may lose money. OptionPub and all individuals affiliated with this site assume no responsibility for your trading and investment results. The indicators, strategies, columns, articles and all other features are strictly for communication purposes only and should not be construed as investment advice. Information for any trading observations are obtained from sources believed to be reliable, but we do not warrant its completeness or accuracy, or warrant any results from the use of the information. Your use of the trading observations is entirely at your own risk and it is your sole responsibility to evaluate the accuracy, completeness and usefulness of the information. Your information may be shared with our educational partners. You must assess the risk of any trade with your licensed investment professional and make your own independent decisions regarding any securities or investments mentioned herein. Affiliates of OptionPub may have a position or effect transactions in the securities or investments described herein (or options thereon) and/or otherwise employ trading strategies that may be consistent or inconsistent with the provided strategies."