We see the grim news every day – the markets keep falling, and there appears to be no end in sight. Key drivers to the diving market prices are rising inflation, food and gas prices, supply chain issues, job market participation, the war in Ukraine and ongoing pandemic concerns.
And now a baby formula crisis. When will it all end?
While there is no shortage of pundits assigning blame for the current market conditions, in the long-run markets are usually resilient. An old Wall Street adage comes to mind.
When they’re yelling, start selling
When they’re crying, start buying
Are Investors Crying Yet?
The news would have you think so. Gas prices are north of $4.00 per gallon. There’s a nationwide shortage of baby formula. Ukraine and Russia are major wheat producers, but they are locked in conflict and sanctions. Food prices could continue to escalate. Housing prices, mortgage interest and rents are pricing many out of the market.
How to use the MACD indicator
New PDF training guide explains the pillars of successful technical trading. Like how to understand common chart patterns, candlestick signals, stochastics and more.
Download it Now
From an investment and trading perspective, markets are sharply down, and are continuing to drop day-over-day. Tweets like this are flooding the internet.

While some may have cashed-out and are sitting on the sidelines, others are still in the market and waiting for a bottom to form. Will this downturn continue, and if so, how long will it last?
Key Price Levels to Watch. Could this be the time to start buying the dips?
Let’s take a look at a couple of scenarios on the weekly charts:
Scenario 1: Dow Futures 29,000 – 200 SMA Holds as Support

The 200 Simple Moving Average (SMA), drawn in red, is generally used to help identify long-term trends. When price travels above the 200 SMA the market is generally considered to be in an uptrend.
The DOW has been traveling above the 200 SMA since May, 2020. As of this writing (05/12/2022),the Dow is falling to 31,160 and has plenty of room to drop to 29,000 at the 200 SMA.
If the 200 SMA holds up as support on this weekly chart, then it’s a price level worth watching. It could signal that a bottom of the market has formed and there will be a slow resumption of growth back to the upside.
Scenario 2: Dow 27,500 and 25,500 – Key Fibonacci Retracement Levels Hit
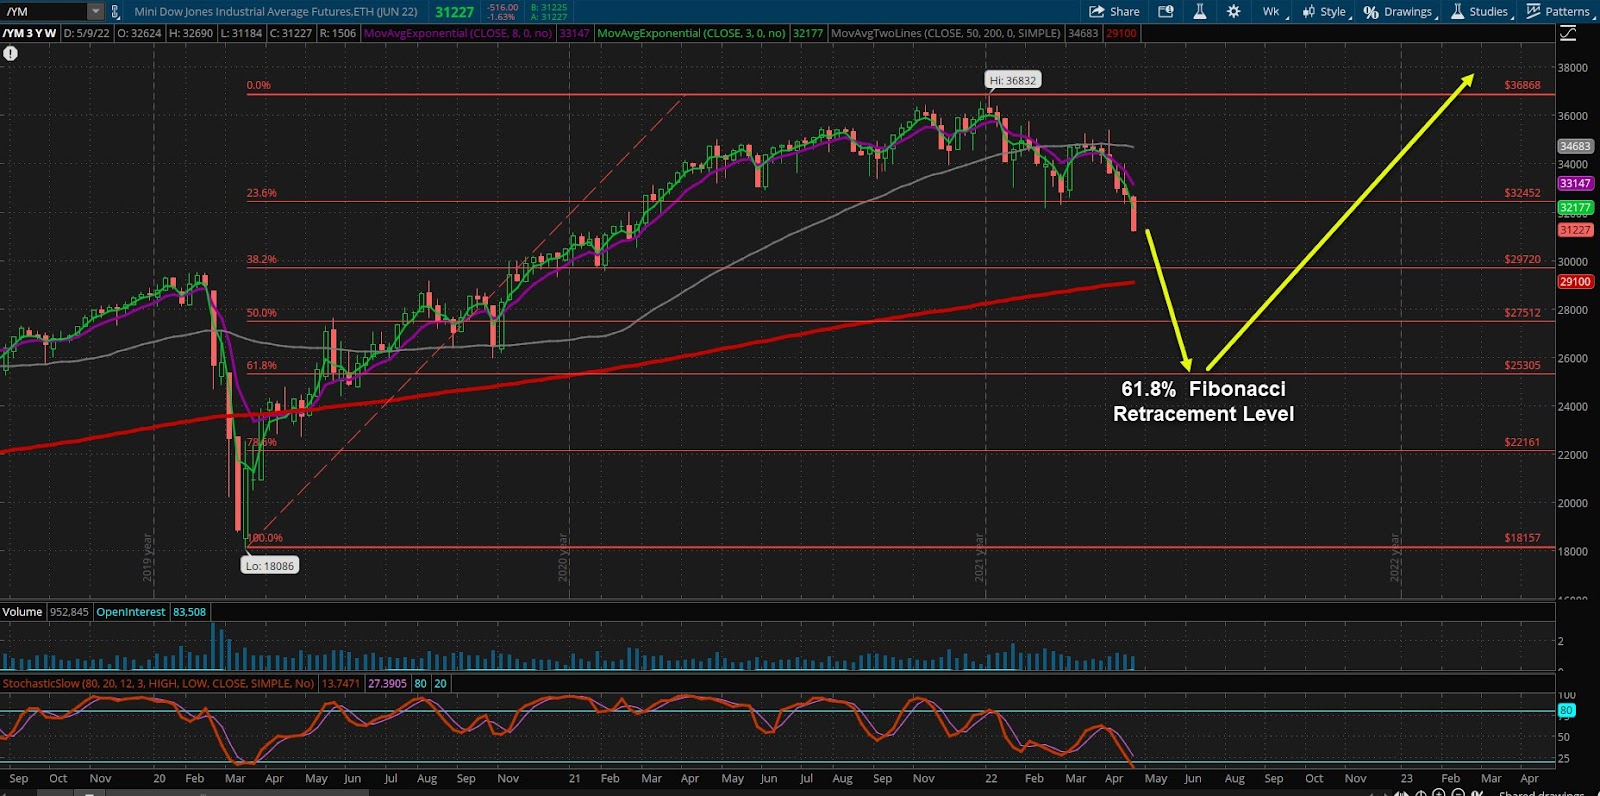
If the 200 SMA does not hold up as support, then it might be worth taking a look at key Fibonacci retracement levels.
In this example a Fibonacci Retracement diagram was drawn from the 2020 Covid Low to the January 2022 high for DOW Futures.
The first stop is the 50% retracement level at around 27,500. It’s a level worth watching. The key will be to look at price consolidation, and buyers starting to push the market back north.
The next level to watch is the 61.8% level at around 25,000. The 61.8% level is often the retracement level that is reached after a previous rally. This level is well worth watching.
What About the Fear Index (VIX)?

The VIX measures volatility in the market, and is commonly referred to as the “Fear Index”. The higher the VIX, the more volatility is in place and the steeper the dive in the markets.
When markets go down, the VIX goes up. When markets are rallying, the VIX goes down.
Recently, the VIX has rallied from 18.40 to just above 30. Over the past few years since the onset of the pandemic, the 40 price level has held as a ceiling.
There is still room for the VIX to travel from 30-40, which would suggest further declines in the markets are possible. If the markets test the 40 level at the VIX, it’s worth looking to see if here is a reversal in the Fear Index.
Also, note that the Stochastic oscillator at the bottom of the VIX charts are in overbought territory, signaling a potential reversal in the VIX.
Things to Keep in Mind
Markets are extremely volatile, and there is a ton of geopolitical uncertainty in play.
Make no mistake about it, it is absolutely possible that markets could continue to tank to unprecedented levels.
The purpose of this article is to step back and look at the Dow Jones Industrial Average from a big-picture standpoint over the past few years. That’s why weekly charts were used. They tend to smooth out the day-to-day volatility that we observe in the moment.
The price levels identified may or may not hold, but if they do hold, it may well signal that peak fear is in, the bottom has formed and a recovery could be imminent.
Bonus Article:
What it means to “Bet the Jockey”

If you only looked at the markets after the close yesterday it would seem like a pretty uneventful day:
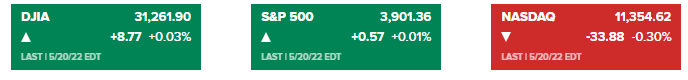
What the numbers above do not show is that at one point the Dow was down 700+ points and the markets officially entered a bear market.
That whole “entered a bear market thing is really just a technical phrase because anyone who has owned just about any asset outside of energy and a few select NFT projects has been feeling the “bear” market all year.
But rather than sit at home and listen to talking heads about why the world is about to end, let’s dive in…
Click Here for the Full Article