Today I’m going to you one of my all-time favorite indicators to help you identify high probability trading opportunities in different market conditions.
One of my all-time favorite indicators is the RSI Oscillator, which stands for relative strength index. The RSI is classified as a momentum oscillator, measuring the velocity and magnitude of directional price movements.
The RSI was originally created for the commodities market in the seventies, before stocks became volatile. But over the years, with the stock market gaining volatility, the RSI has gained substantial popularity with all financial markets, including stocks and forex markets.
In short, the RSI measures short term overbought and oversold levels that occur in different market conditions.
The RSI typically uses a 14-day timeframe or look back period, but I like to modify the time frame to 10 days, since I’m using the indicator for swing trades, which need quicker response time.
As you can see by this chart, the RSI is measured on a scale from 0 to 100, with high and low levels marked at 70 and 30. If the RSI moves above the 70 level, the asset is considered overbought, and is due for a correction, while price movement below the 30 level, indicates that the stock is oversold and should bounce back higher over the next several sessions.
Grab this report and receive two strategies that explain how you can use options to substantially increase your trading consistency while dramatically managing your risk.
Grab Your FREE Report Right Here!
While there are dozens of oscillators that are designed to identify overbought and oversold levels, the RSI is one of the least sensitive indicators, which means it’s not prone to numerous false signals. The RSI requires the underlying asset to make a substantial move either up or down, before generating an overbought or over-sold signal, which is the biggest reason why I’ve used it consistently for over twenty years.
In this example, you can see how Apple stock sells off strongly, causing the 10 day RSI to generate a very overbought signal, going all the way down to the 22 level in July, before moving higher once again.
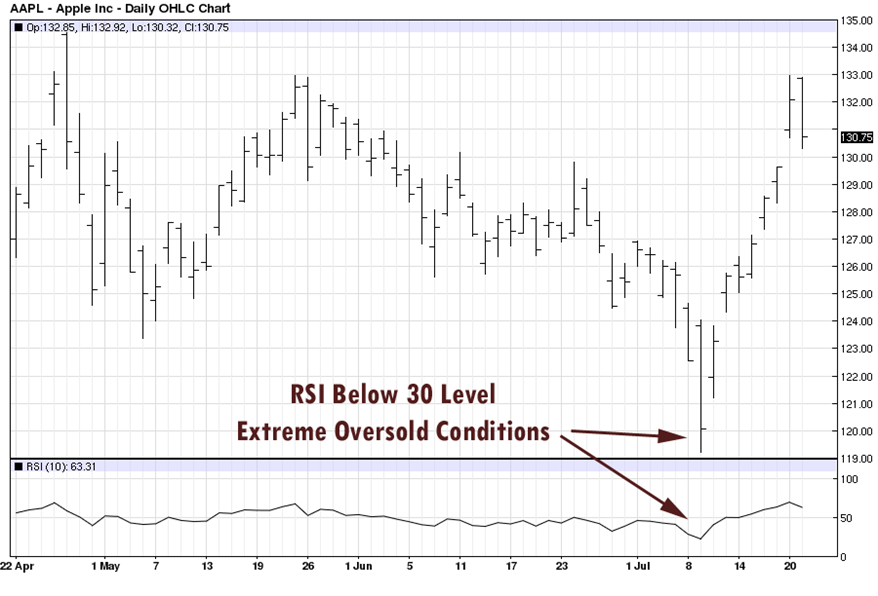
I specifically brought up this example, so you can see that it’s not an easy job to push the RSI into oversold territory.
Notice the sell-off that occurred earlier in May.
While Apple sold off over $10 dollars over a one week time period, the RSI barely moved below 50.
During this period of time, the majority of oscillators moved into oversold territory, but the RSI bared moved below neutral.
And that’s the single biggest reason why I prefer the RSI to other oscillators, it has very low sensitivity to price action, especially when compared to other oscillators that measure overbought or oversold price levels.
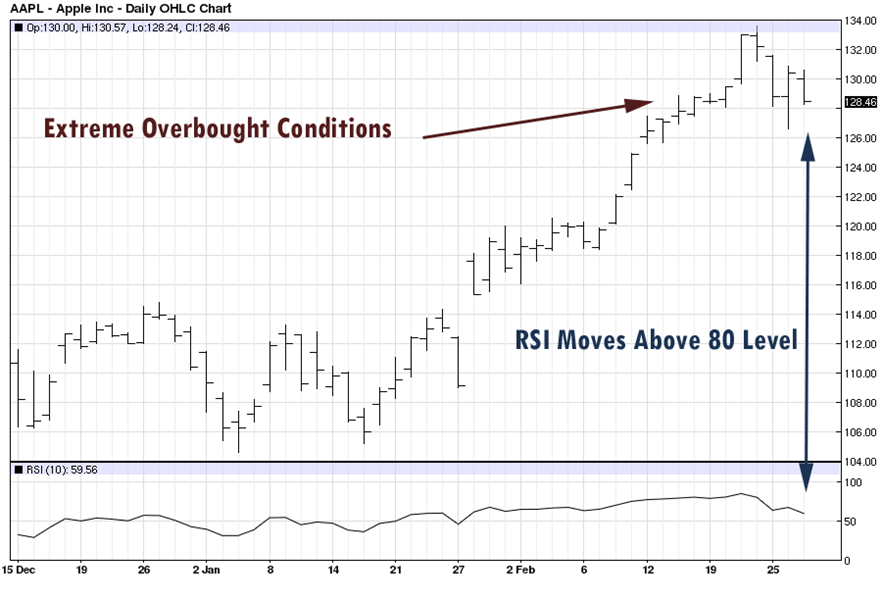
This is another example of Apple stock price, moving up about 30 dollars before RSI moves into overbought territory.
The RSI moved as high as 80 in this example, prior to Apple starting to move lower, which once again, demonstrates just how robust the RSI indicator really is.
Now that I’ve demonstrated the most common way the RSI is utilized, I want to show you some tactics that will help you gain even more value out of the RSI indicator.
This method will help increase your profit potential and decrease the percentage of losing trades.
While most traders simply use the RSI to gauge short term overbought or oversold levels, the great majority of the time, this leads to taking trades in the opposite direction of the main trend or to put in different words, trying to pick tops and bottoms and that’s one of the worst mistakes beginners make.
Not only is it much harder to pick the top or the bottom of a price swing consistently, but even when you are correct in your timing, the stock can stay around the highs or lows for several months before turning around, which can turn your swing trade into a long term trade, tying up your capital for several months.
In my experience, the lowest risk trading opportunities occur when you initiate positions in the direction of the long term trend, and against the direction of the short term trend, after the stock had a chance to pull strongly away from the main trend.
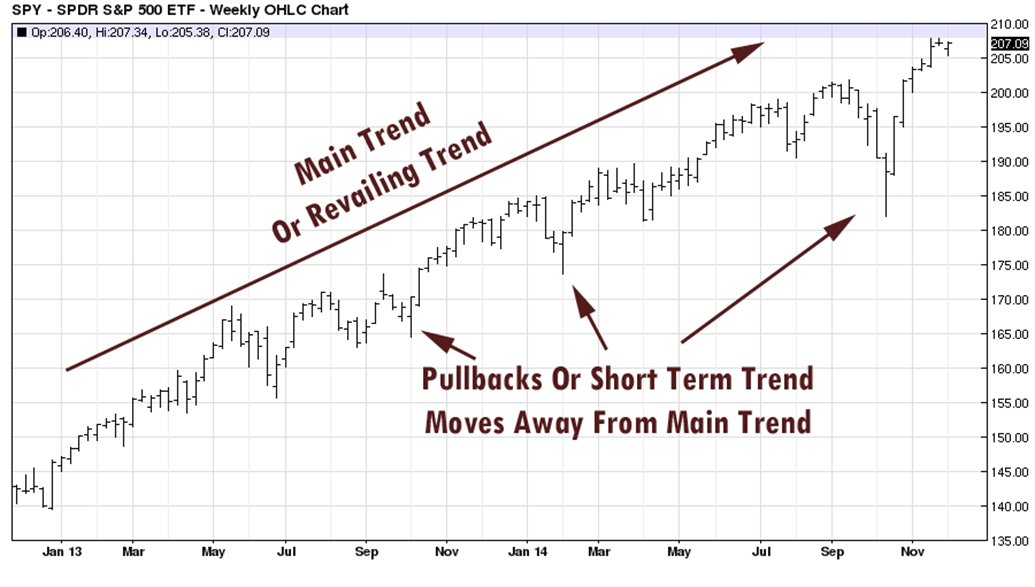
Another term for this type of trading set ups is called a pullback or a retracement pattern.
This way you enter in the direction that offers the highest probability of further directional movement and at the same time after the stock had a chance to pause and move a bit lower, prior to regaining momentum in the direction of the main trend.
To identify the main trend, I will use the 1 year or the 52 week price high, typically stocks are trending very strongly when they reach a one year price high.
Similarly, when stocks are trading at or above the 1 year price high, they are more often than not outperforming the overall market, which gives them strong relative strength in relationship to the market, which is another sign of continued strength.
Once we identify stocks that are making 1 year or 52 week price highs, the next step is to identify those stocks that are temporarily moving lower into oversold territory, prior to moving higher once again, and continuing the trend up.
To identify these short term oversold conditions, we will use the RSI indicator, since it can help us identify very short term oversold trading conditions.
So what we are doing, is combining two very simple technical filters, the 52 week high and the RSI indicator, into a very simple strategy to help us find strong trending stocks that are temporarily pulling back, giving ideal entry conditions, without expositing us to a high percentage of false breakouts that occurs when initiating the trade while the stock is breaking out, instead of pulling back.
Over many years of back testing and trading experience, I find that giving the stock up to 10 trading days to reach oversold RSI levels works out well and because this filter does not require any type of visual interpretation, it’s very simple to identify using very basic technical analysis screening tools.
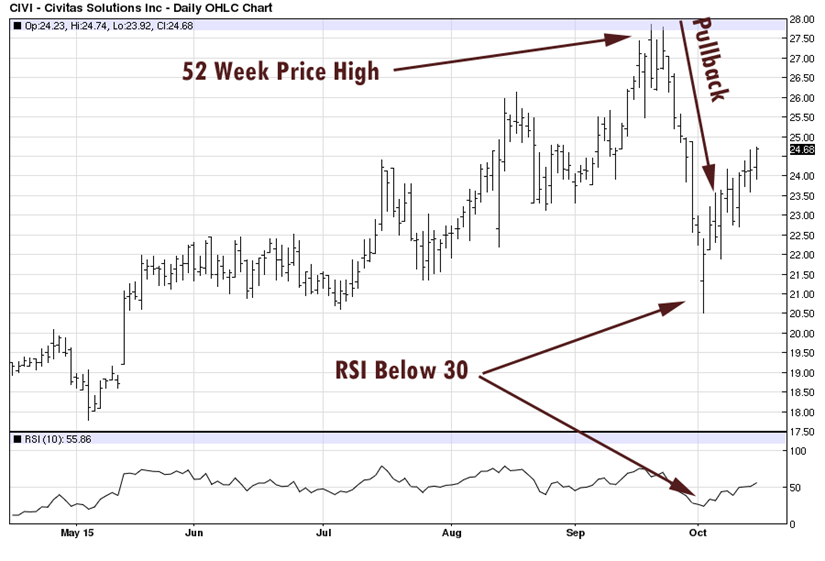
This is a good example of a stock that reached 52 week price high and then over the next 2 weeks moved to oversold levels, before moving higher once again.
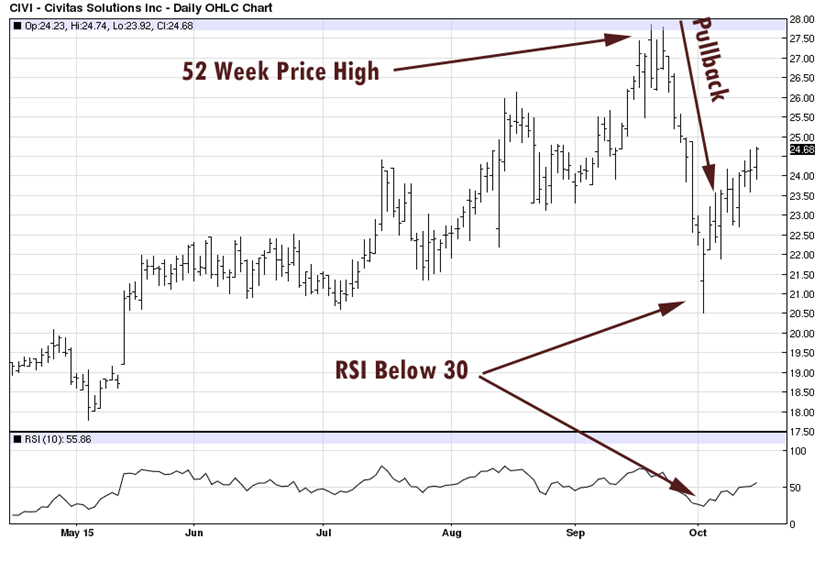
Combining the 52 week price high with the RSI indicator can result in a very simple, yet effective method of identifying low risk trading opportunities.
Here’s another example, where you can see how the stock reaches the 52 or the 1 year price high and then pulling back over the next 10 days or two weeks before moving higher once again.
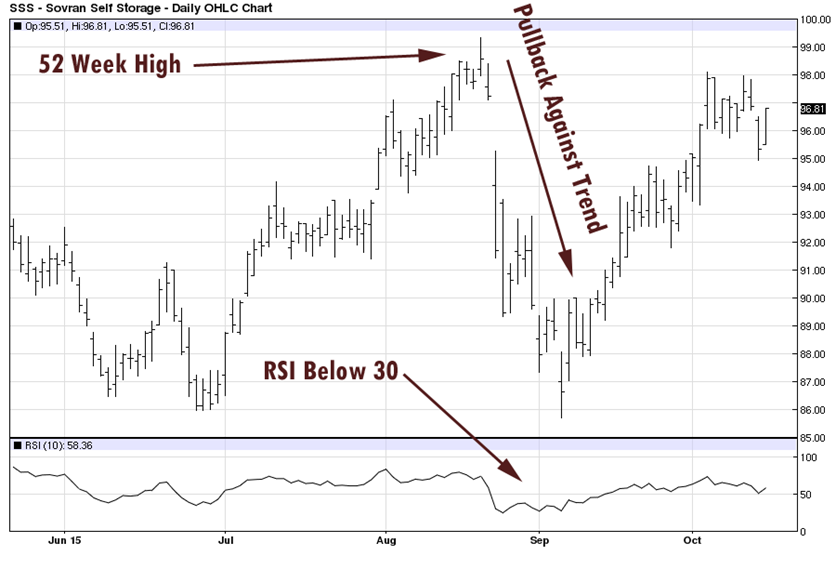
The great thing about this method aside from the simplicity is the fact that you are trading in the direction of the main trend and initiating trades that are very close to the 52-week price high, which as I mentioned previously, increases the odds of the price continuing to move higher.
Over the years, I’ve back tested several pullback strategies and applying just about every possible technical indicator and filter imaginable and continue to find the 10-day RSI and 52 week high to be robust as ever.
